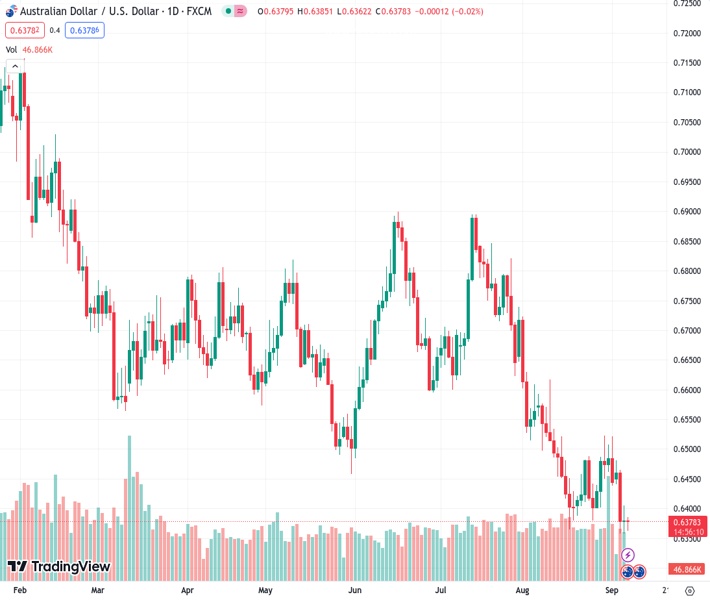
Despite a lack of recent momentum, the AUDUSD pair at 0.63795 has reversed the corrective bounce seen the previous day from its yearly low. According to the perspective of @nehcap, there is an expectation of limited downward movement.
…
This is a premium post.
[s2If !current_user_can(access_s2member_level4)]Please register for FREE REGISTER to read full post below containing analysis. In case of any error or you think you are not able to read the full post below, please email us at support#nehcap.com [lwa][/s2If] [s2If current_user_can(access_s2member_level1)]
- AUD/USD reverses the previous day’s corrective bounce off yearly low despite lacking momentum of late.
The pair currently trades last at 0.63795.
The previous day high was 0.6405 while the previous day low was 0.6357. The daily 38.2% Fib levels comes at 0.6387, expected to provide resistance. Similarly, the daily 61.8% fib level is at 0.6375, expected to provide support.
AUD/USD holds lower grounds near 0.6375-70 amid the early hours of Thursday’s European session, fading the previous day’s rebound from a 10-month low.
That said, the mixed trade numbers from Australia and China jostle with a lack of hawkish aura in the Reserve Bank of Australia (RBA) Governor Philip Lowe’s last statements as the Aussie central bank leader seem to weigh on the Aussie pair of late.
However, the nearly oversold RSI (14) line suggests limited downside room for the AUD/USD pair, which in turn highlights a downward-sloping support line from early March, close to 0.6330 at the latest.
In a case where the Aussie bears ignore the RSI conditions and break the stated key support line, the November 2022 bottom of around 0.6272 will act as the final defense of the pair buyers before highlighting the odds of witnessing a fall towards the last yearly trough of 0.6170.
Meanwhile, the AUD/USD pairs’ recovery remains unimpressive below a convergence of the 21-day Exponential Moving Average (EMA) and a downward-sloping resistance line from July 13, close to 0.6460 at the latest.
Following that, multiple levels marked since late May surrounding 0.6500 could check the AUD/USD bulls before giving them control.
Overall, the AUD/USD pair remains on the bear’s radar even as the downside room appears limited.
Trend: Limited downside expected
Technical Levels: Supports and Resistances
AUDUSD currently trading at 0.6374 at the time of writing. Pair opened at 0.638 and is trading with a change of -0.09% % .
| Overview | Overview.1 | |
|---|---|---|
| 0 | Today last price | 0.6374 |
| 1 | Today Daily Change | -0.0006 |
| 2 | Today Daily Change % | -0.09% |
| 3 | Today daily open | 0.638 |
The pair remains strongly bearish on the daily time frame. It trades below the 20 SMA @ 0.6444, 50 SMA 0.6591, 100 SMA @ 0.6634 and 200 SMA @ 0.6717.
| Trends | Trends.1 | |
|---|---|---|
| 0 | Daily SMA20 | 0.6444 |
| 1 | Daily SMA50 | 0.6591 |
| 2 | Daily SMA100 | 0.6634 |
| 3 | Daily SMA200 | 0.6717 |
The previous day high was 0.6405 while the previous day low was 0.6357. The daily 38.2% Fib levels comes at 0.6387, expected to provide resistance. Similarly, the daily 61.8% fib level is at 0.6375, expected to provide support.
Note the levels of interest below:
- Pivot support is noted at 0.6356, 0.6333, 0.6309
- Pivot resistance is noted at 0.6404, 0.6428, 0.6451
| Levels | Levels.1 |
|---|---|
| Previous Daily High | 0.6405 |
| Previous Daily Low | 0.6357 |
| Previous Weekly High | 0.6522 |
| Previous Weekly Low | 0.6401 |
| Previous Monthly High | 0.6724 |
| Previous Monthly Low | 0.6364 |
| Daily Fibonacci 38.2% | 0.6387 |
| Daily Fibonacci 61.8% | 0.6375 |
| Daily Pivot Point S1 | 0.6356 |
| Daily Pivot Point S2 | 0.6333 |
| Daily Pivot Point S3 | 0.6309 |
| Daily Pivot Point R1 | 0.6404 |
| Daily Pivot Point R2 | 0.6428 |
| Daily Pivot Point R3 | 0.6451 |
[/s2If]
Download Nehcap EAWe have two EAs that are operational on our LIVE accounts.
- EA-FIX: Check out the details here. Download EA-FIX . EA-FIX is a non-grid HFT scalper.
- EA-GROWTH: High quality low dd EA using trend grids. Download EA_GROWTHJoin Our Telegram Group


