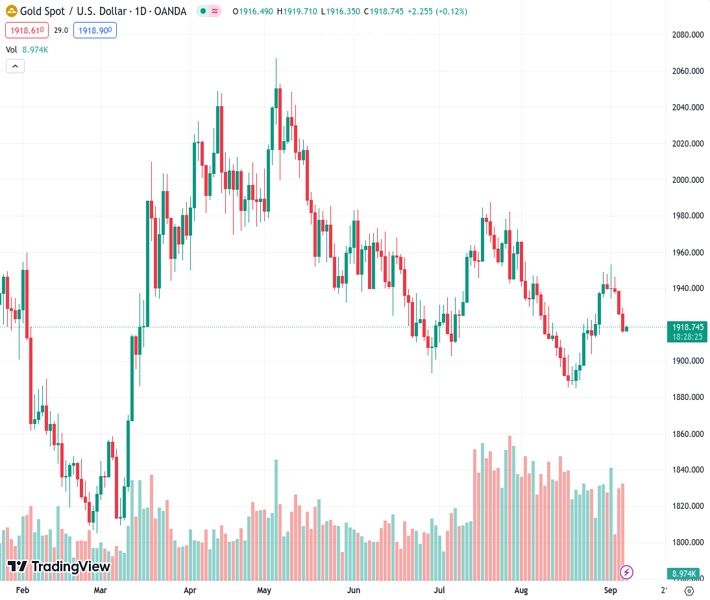
The price of gold, represented by #XAUUSD at 1,918.62, experienced some slight upward movement on Thursday. However, this momentum did not continue.
…
This is a premium post.
[s2If !current_user_can(access_s2member_level4)]Please register for FREE REGISTER to read full post below containing analysis. In case of any error or you think you are not able to read the full post below, please email us at support#nehcap.com [lwa][/s2If] [s2If current_user_can(access_s2member_level1)]
- Gold price gains some positive traction on Thursday, albeit lacks follow-through.
The pair currently trades last at 1918.62.
The previous day high was 1929.21 while the previous day low was 1915.33. The daily 38.2% Fib levels comes at 1920.63, expected to provide resistance. Similarly, the daily 61.8% fib level is at 1923.91, expected to provide resistance.
Gold price shows some resilience near the very important 200-day Simple Moving Average (SMA) and attracts some buying during the Asian session on Thursday. The XAU/USD currently trades just below the $1,920 level, up nearly 0.15% for the day, and for now, seems to have snapped a three-day losing streak to over a one-week low touched on Wednesday.
Concerns about the worsening economic conditions in China, along with persistent US-China trade tensions, continue to weigh on investors’ sentiment. This is evident from a generally weaker tone around the equity markets and turns out to be a key factor that benefits the precious metal’s safe-haven status. Apart from this, subdued US Dollar (USD) price action lends additional support to the Gold price, though any meaningful appreciating move still seems elusive.
The prospects for further policy tightening by the Federal Reserve (Fed), bolstered by the upbeat US macro data on Wednesday, should limit any meaningful USD corrective decline and cap gains for the XAU/USD. The Institute for Supply Management (ISM) reported that business activity in the US services sector unexpectedly picked up pace in August and its non-manufacturing PMI rose from 52.7 in July to 54.5 last month – the highest reading since February.
Additional details of the report showed a rise in new orders, pointing to a resilient US economy, and higher Prices Paid sub-component, which was seen as potential signs of still-elevated inflation pressures. This increased the odds for one more 25 basis points (bps) Fed rate hike move by the end of this year, which, in turn, pushed the yield on the benchmark 10-year US government bond closer to the August 23 peak and the USD to its highest level since March 9.
The aforementioned fundamental backdrop makes it prudent to wait for some follow-through buying around the Gold price before confirming that the recent pullback from a one-month peak, around the $1,953 area touched last Friday, has run its course. On the flip side, acceptance below the technically significant 200-day SMA is needed to reaffirm the negative bias. Traders now look to the US Weekly Initial Jobless Claims data to grab short-term opportunities.
Technical Levels: Supports and Resistances
XAUUSD currently trading at 1918.58 at the time of writing. Pair opened at 1916.76 and is trading with a change of 0.09 % .
| Overview | Overview.1 | |
|---|---|---|
| 0 | Today last price | 1918.58 |
| 1 | Today Daily Change | 1.82 |
| 2 | Today Daily Change % | 0.09 |
| 3 | Today daily open | 1916.76 |
The pair is trading above its 20 Daily moving average @ 1915.35, below its 50 Daily moving average @ 1932.0 , below its 100 Daily moving average @ 1952.15 and above its 200 Daily moving average @ 1917.55
| Trends | Trends.1 | |
|---|---|---|
| 0 | Daily SMA20 | 1915.35 |
| 1 | Daily SMA50 | 1932.00 |
| 2 | Daily SMA100 | 1952.15 |
| 3 | Daily SMA200 | 1917.55 |
The previous day high was 1929.21 while the previous day low was 1915.33. The daily 38.2% Fib levels comes at 1920.63, expected to provide resistance. Similarly, the daily 61.8% fib level is at 1923.91, expected to provide resistance.
Note the levels of interest below:
- Pivot support is noted at 1911.66, 1906.55, 1897.78
- Pivot resistance is noted at 1925.54, 1934.31, 1939.42
| Levels | Levels.1 |
|---|---|
| Previous Daily High | 1929.21 |
| Previous Daily Low | 1915.33 |
| Previous Weekly High | 1953.01 |
| Previous Weekly Low | 1912.84 |
| Previous Monthly High | 1966.08 |
| Previous Monthly Low | 1884.85 |
| Daily Fibonacci 38.2% | 1920.63 |
| Daily Fibonacci 61.8% | 1923.91 |
| Daily Pivot Point S1 | 1911.66 |
| Daily Pivot Point S2 | 1906.55 |
| Daily Pivot Point S3 | 1897.78 |
| Daily Pivot Point R1 | 1925.54 |
| Daily Pivot Point R2 | 1934.31 |
| Daily Pivot Point R3 | 1939.42 |
[/s2If]
Download Nehcap EAWe have two EAs that are operational on our LIVE accounts.
- EA-FIX: Check out the details here. Download EA-FIX . EA-FIX is a non-grid HFT scalper.
- EA-GROWTH: High quality low dd EA using trend grids. Download EA_GROWTHJoin Our Telegram Group


