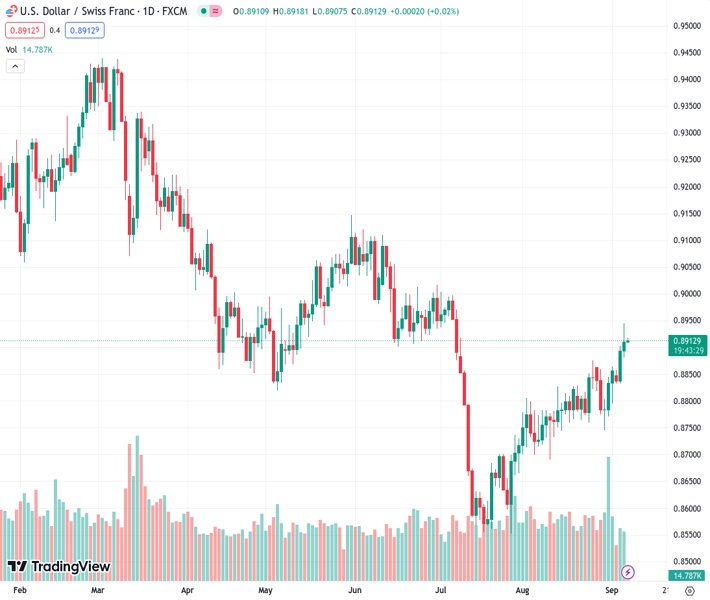
For the third day in a row, the USDCHF pair is trading in positive territory, currently at a price of 0.89139.
…
This is a premium post.
[s2If !current_user_can(access_s2member_level4)]Please register for FREE REGISTER to read full post below containing analysis. In case of any error or you think you are not able to read the full post below, please email us at support#nehcap.com [lwa][/s2If] [s2If current_user_can(access_s2member_level1)]
- USD/CHF trades in positive territory for the third consecutive day.
The pair currently trades last at 0.89139.
The previous day high was 0.8945 while the previous day low was 0.8881. The daily 38.2% Fib levels comes at 0.8921, expected to provide resistance. Similarly, the daily 61.8% fib level is at 0.8906, expected to provide support.
The USD/CHF pair gains momentum near 0.8915 during the early Asian session on Thursday. The major pair attracts some buyers close to the monthly highs since July following the upbeat US economic data. Meanwhile, the US Dollar Index (DXY), a measure of the value of USD against six other major currencies, hovers around 104.85 after retreating from a six-month high of 105.02.
Markets expect the Federal Reserve (Fed) will keep interest rates over 5% for a longer period. The Federal Reserve (Fed) Governor Christopher Waller stated that they have further room to increase interest rates, but the data will determine whether the Fed needs to hike rates again and if it is done hiking rates. While, Fed Boston President Susan Collins pointed out the risk of an inappropriately restrictive monetary policy stance and called for a patient and careful, but deliberate policy.
Institute for Supply Management (ISM) reported on Wednesday that the US ISM Services PMI rose to 54.5 in August from 52.7 the previous month, above the market consensus of 52.5. This figure is the highest since February. Furthermore, the S&P Global Composite’s final readings fell to 50.2 in August from 50.4 in July.
On the other hand, The office of US Trade Representative Katherine Tai extended China’s “Section 301” tariff exemptions on 352 Chinese imports and 77 COVID-19-related categories until December 31, which were supposed to expire on September 30, per Reuters. This action will allow for more consideration under a statutory four-year review That said, the negative development or the renewed trade war tension between the US and China might benefit the traditional safe-haven CHF and act as a headwind for USD/CHF.
Furthermore, the downbeat Swiss economic data weigh on the Swiss France (CHF) this week. That said, the Swiss economy remained stagnant in the second quarter. The nation’s Gross Domestic Product (GDP) Q2 dropped to 0.0% QoQ, below the market consensus of 0.1% and the previous quarter’s reading of 0.3%. On an annual basis, the growth number remained at 0.5% as expected, the Swiss Statistics reported on Monday.
Later this week, the US weekly Initial Jobless Claims and Unit Labor Costs for Q2 will be due. These figures could give a clear direction for the USD/CHF pair. In the absence of top-tier economic data releases from Switzerland later this week, the USD price dynamic will be the main driver for the USD/CHF pair.
Technical Levels: Supports and Resistances
USDCHF currently trading at 0.8916 at the time of writing. Pair opened at 0.8912 and is trading with a change of 0.04 % .
| Overview | Overview.1 | |
|---|---|---|
| 0 | Today last price | 0.8916 |
| 1 | Today Daily Change | 0.0004 |
| 2 | Today Daily Change % | 0.0400 |
| 3 | Today daily open | 0.8912 |
The pair is trading above its 20 Daily moving average @ 0.8816, above its 50 Daily moving average @ 0.8779 , above its 100 Daily moving average @ 0.8879 and below its 200 Daily moving average @ 0.9058
| Trends | Trends.1 | |
|---|---|---|
| 0 | Daily SMA20 | 0.8816 |
| 1 | Daily SMA50 | 0.8779 |
| 2 | Daily SMA100 | 0.8879 |
| 3 | Daily SMA200 | 0.9058 |
The previous day high was 0.8945 while the previous day low was 0.8881. The daily 38.2% Fib levels comes at 0.8921, expected to provide resistance. Similarly, the daily 61.8% fib level is at 0.8906, expected to provide support.
Note the levels of interest below:
- Pivot support is noted at 0.888, 0.8849, 0.8817
- Pivot resistance is noted at 0.8944, 0.8976, 0.9007
| Levels | Levels.1 |
|---|---|
| Previous Daily High | 0.8945 |
| Previous Daily Low | 0.8881 |
| Previous Weekly High | 0.8865 |
| Previous Weekly Low | 0.8745 |
| Previous Monthly High | 0.8876 |
| Previous Monthly Low | 0.8690 |
| Daily Fibonacci 38.2% | 0.8921 |
| Daily Fibonacci 61.8% | 0.8906 |
| Daily Pivot Point S1 | 0.8880 |
| Daily Pivot Point S2 | 0.8849 |
| Daily Pivot Point S3 | 0.8817 |
| Daily Pivot Point R1 | 0.8944 |
| Daily Pivot Point R2 | 0.8976 |
| Daily Pivot Point R3 | 0.9007 |
[/s2If]
Download Nehcap EAWe have two EAs that are operational on our LIVE accounts.
- EA-FIX: Check out the details here. Download EA-FIX . EA-FIX is a non-grid HFT scalper.
- EA-GROWTH: High quality low dd EA using trend grids. Download EA_GROWTHJoin Our Telegram Group


