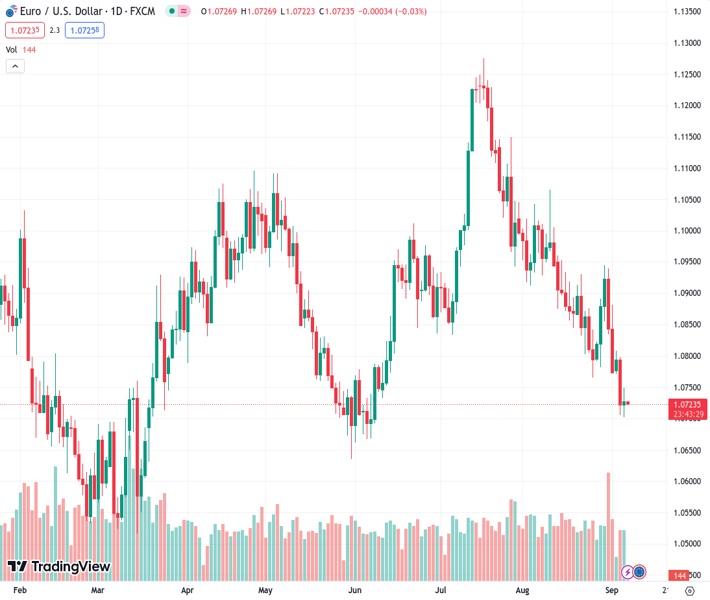
The EURUSD is currently at a level of 1.0725, and it is trading in a neutral manner with slight gains.
…
This is a premium post.
[s2If !current_user_can(access_s2member_level4)]Please register for FREE REGISTER to read full post below containing analysis. In case of any error or you think you are not able to read the full post below, please email us at support#nehcap.com [lwa][/s2If] [s2If current_user_can(access_s2member_level1)]
- EUR/USD trades neutral at the 1.0725 level, with mild gains.
The pair currently trades last at 1.07263.
The previous day high was 1.0798 while the previous day low was 1.0706. The daily 38.2% Fib levels comes at 1.0742, expected to provide resistance. Similarly, the daily 61.8% fib level is at 1.0763, expected to provide resistance.
The EUR/USD consolidated Tuesday’s losses, which saw the pair losing more than 0.60%. The Shared Currency’s movements were driven mainly by a broad-based USD and EUR strength against their rivals on the back of higher US and German yields.
The US reported that the ISM Services PMI from the US from August increased to 54.5, higher than the 52.5 expected and the previous 52.7, and that outcome boosted hawkish bets on the Federal Reserve (Fed). After a mixed Nonfarm Payrolls report released last Friday, which made investors refrain from betting on one last hike, the CME FedWatch Tool now indicated that swaps markets are discounting higher odds of a 25 basis point (bps) increase in November.
The US also reported the Fed Beige Book, highlighting that the economy “modestly” grew in July and August and that the job growth was subdued.
On the Euro’s side, the European Central Bank’s (ECB) Governing Council will meet next week, and there are growing expectations that a 25 basis point (bps) hike will be announced. Analysts at Danske Bank pointed out that the persistently high inflation will be the main driver of the decision, which is expected to be the last hike of the cycle. In that sense, those expectations seem to keep the European currency afloat via rising German yields.
The daily chart flashes signals of a bearish outlook for the short term for the EUR/USD. Regarding indicators, the Relative Strength Index (RSI) resides below its midline in negative territory, exhibiting a southward trajectory. At the same time, the Moving Average Convergence Divergence (MACD) prints red bars, underscoring the growing bearish momentum. Additionally, the presence of selling momentum is seen on the four-hour chart, with both indicators residing deep in negative territory.
On the bigger picture, the pair now resided the 20,100 and 200-day Simple Moving Averages (SMA) for the first time since November 2022, pointing out that the bears are in control.
Support levels: 1.0700, 1.0680, 1.0650.
Resistance levels: 1.0800, 1.0820 (200-day SMA), 1.0850.
Technical Levels: Supports and Resistances
EURUSD currently trading at 1.0725 at the time of writing. Pair opened at 1.0722 and is trading with a change of 0.03 % .
| Overview | Overview.1 | |
|---|---|---|
| 0 | Today last price | 1.0725 |
| 1 | Today Daily Change | 0.0003 |
| 2 | Today Daily Change % | 0.0300 |
| 3 | Today daily open | 1.0722 |
The pair remains strongly bearish on the daily time frame. It trades below the 20 SMA @ 1.0865, 50 SMA 1.0961, 100 SMA @ 1.0918 and 200 SMA @ 1.082.
| Trends | Trends.1 | |
|---|---|---|
| 0 | Daily SMA20 | 1.0865 |
| 1 | Daily SMA50 | 1.0961 |
| 2 | Daily SMA100 | 1.0918 |
| 3 | Daily SMA200 | 1.0820 |
The previous day high was 1.0798 while the previous day low was 1.0706. The daily 38.2% Fib levels comes at 1.0742, expected to provide resistance. Similarly, the daily 61.8% fib level is at 1.0763, expected to provide resistance.
Note the levels of interest below:
- Pivot support is noted at 1.0686, 1.065, 1.0594
- Pivot resistance is noted at 1.0778, 1.0834, 1.087
| Levels | Levels.1 |
|---|---|
| Previous Daily High | 1.0798 |
| Previous Daily Low | 1.0706 |
| Previous Weekly High | 1.0946 |
| Previous Weekly Low | 1.0772 |
| Previous Monthly High | 1.1065 |
| Previous Monthly Low | 1.0766 |
| Daily Fibonacci 38.2% | 1.0742 |
| Daily Fibonacci 61.8% | 1.0763 |
| Daily Pivot Point S1 | 1.0686 |
| Daily Pivot Point S2 | 1.0650 |
| Daily Pivot Point S3 | 1.0594 |
| Daily Pivot Point R1 | 1.0778 |
| Daily Pivot Point R2 | 1.0834 |
| Daily Pivot Point R3 | 1.0870 |
[/s2If]
Download Nehcap EAWe have two EAs that are operational on our LIVE accounts.
- EA-FIX: Check out the details here. Download EA-FIX . EA-FIX is a non-grid HFT scalper.
- EA-GROWTH: High quality low dd EA using trend grids. Download EA_GROWTHJoin Our Telegram Group


