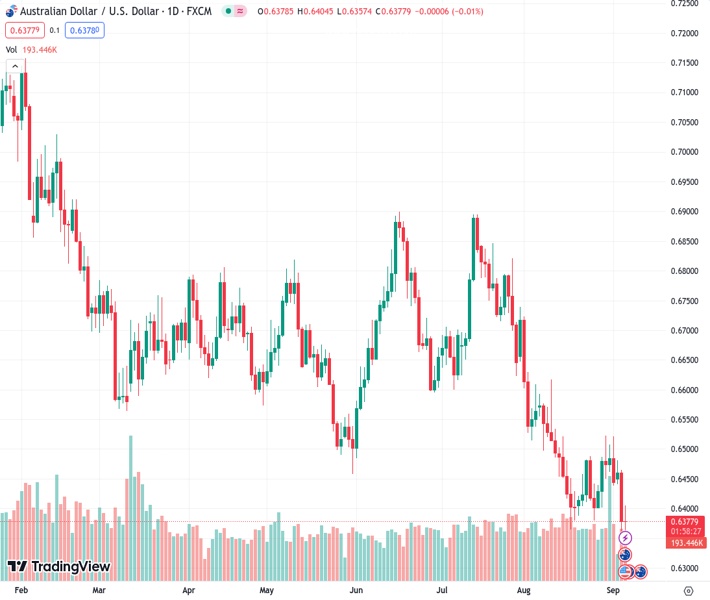
The AUDUSD pair fluctuated between 0.6360 and 0.6400 on Wednesday.
…
This is a premium post.
[s2If !current_user_can(access_s2member_level4)]Please register for FREE REGISTER to read full post below containing analysis. In case of any error or you think you are not able to read the full post below, please email us at support#nehcap.com [lwa][/s2If] [s2If current_user_can(access_s2member_level1)]
- AUD/USD traded in the 0.6360 – 0.6400 range on Wednesday.
The pair currently trades last at 0.63788.
The previous day high was 0.6465 while the previous day low was 0.6358. The daily 38.2% Fib levels comes at 0.6399, expected to provide resistance. Similarly, the daily 61.8% fib level is at 0.6424, expected to provide resistance.
In Wednesday’s session, the AUD/USD traded neutral but remained vulnerable below 0.6400. On the one hand, strong economic activity reports from the US strengthened the USD, while the AUD struggled to gain momentum after Tuesday’s Reserve Bank of Australia (RBA) decision.
ISM Services PMI lived up to the expectations in August. The figure came in at 54.5, higher than the expected figure of 52.5 and above the previous 52.7. Regarding the Fed, Beige’s book, which reports on the US’s current economic situation through interviews with key business contacts and economists gathered by each of the 12 Federal Reserve Districts, revealed that economic growth was “modest” and job growth “subdued” in July and August. However, it also stated that imbalances persisted with the availability of skilled workers and the number of applicants constrained.
Meanwhile, US bond yields jumped back to weekly highs and depicted that markets are gearing up for another Federal Reserve hike (Fed) hike, which would lift rates to 5.75%. According to the CME FedWatch tool, the odds of a 25 basis point (bps) increase in November rose above 40%, making the USD gain interest. It’s worth highlighting that the Fed stated that it needs to see the economy “cooling” to end its tightening cycle, to strong economic figures fuel hawkish bets for the remainder of the year.
On the AUD’s side, it is struggling to gather momentum after the Reserve Bank of Australia (RBA) held interest steady at 4.10% on Tuesday, adopted a wait-and-see approach and didn’t commit to further hikes.
The AUD/USD daily chart analysis points to a bearish outlook for the short term. The Relative Strength Index (RSI) is situated below its midline in negative territory, displaying a southward trajectory. Likewise, the Moving Average Convergence Divergence (MACD) reveals lower green bars, signifying a growing bearish momentum for the pair. Furthermore, the pair is below the 20,100 and 200-day Simple Moving Averages (SMAs), implying that the bears retain control on a broader scale.
Support levels:0.6360, 0.6350, 0.6330.
Resistance levels: 0.6400, 0.6440 (20-day SMA), 0.6470.
Technical Levels: Supports and Resistances
AUDUSD currently trading at 0.6381 at the time of writing. Pair opened at 0.6379 and is trading with a change of 0.03 % .
| Overview | Overview.1 | |
|---|---|---|
| 0 | Today last price | 0.6381 |
| 1 | Today Daily Change | 0.0002 |
| 2 | Today Daily Change % | 0.0300 |
| 3 | Today daily open | 0.6379 |
The pair remains strongly bearish on the daily time frame. It trades below the 20 SMA @ 0.6451, 50 SMA 0.6596, 100 SMA @ 0.6637 and 200 SMA @ 0.6719.
| Trends | Trends.1 | |
|---|---|---|
| 0 | Daily SMA20 | 0.6451 |
| 1 | Daily SMA50 | 0.6596 |
| 2 | Daily SMA100 | 0.6637 |
| 3 | Daily SMA200 | 0.6719 |
The previous day high was 0.6465 while the previous day low was 0.6358. The daily 38.2% Fib levels comes at 0.6399, expected to provide resistance. Similarly, the daily 61.8% fib level is at 0.6424, expected to provide resistance.
Note the levels of interest below:
- Pivot support is noted at 0.6336, 0.6293, 0.6229
- Pivot resistance is noted at 0.6443, 0.6507, 0.655
| Levels | Levels.1 |
|---|---|
| Previous Daily High | 0.6465 |
| Previous Daily Low | 0.6358 |
| Previous Weekly High | 0.6522 |
| Previous Weekly Low | 0.6401 |
| Previous Monthly High | 0.6724 |
| Previous Monthly Low | 0.6364 |
| Daily Fibonacci 38.2% | 0.6399 |
| Daily Fibonacci 61.8% | 0.6424 |
| Daily Pivot Point S1 | 0.6336 |
| Daily Pivot Point S2 | 0.6293 |
| Daily Pivot Point S3 | 0.6229 |
| Daily Pivot Point R1 | 0.6443 |
| Daily Pivot Point R2 | 0.6507 |
| Daily Pivot Point R3 | 0.6550 |
[/s2If]
Download Nehcap EAWe have two EAs that are operational on our LIVE accounts.
- EA-FIX: Check out the details here. Download EA-FIX . EA-FIX is a non-grid HFT scalper.
- EA-GROWTH: High quality low dd EA using trend grids. Download EA_GROWTHJoin Our Telegram Group


