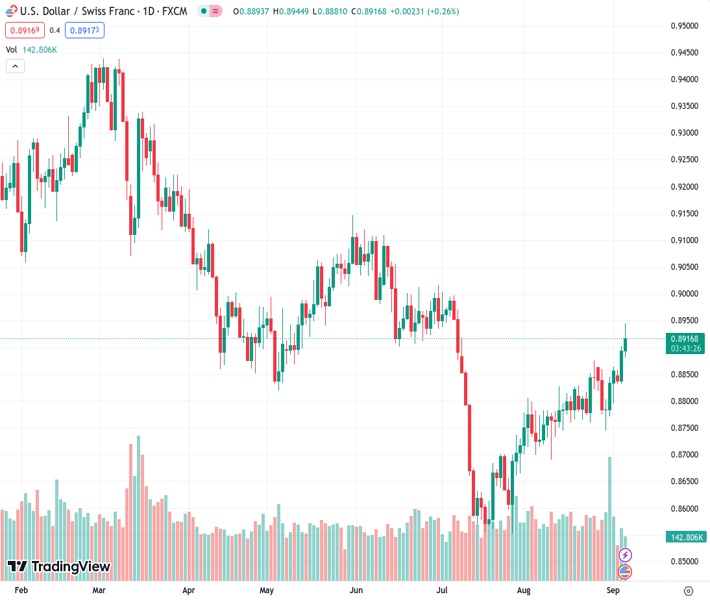
The USD/CHF pair, currently trading at 0.89176, increased to its highest level in a month since July, approaching 0.8920.
…
This is a premium post.
[s2If !current_user_can(access_s2member_level4)]Please register for FREE REGISTER to read full post below containing analysis. In case of any error or you think you are not able to read the full post below, please email us at support#nehcap.com [lwa][/s2If] [s2If current_user_can(access_s2member_level1)]
- USD/CHF rose to monthly highs since July, towards 0.8920.
The pair currently trades last at 0.89176.
The previous day high was 0.8903 while the previous day low was 0.8842. The daily 38.2% Fib levels comes at 0.888, expected to provide support. Similarly, the daily 61.8% fib level is at 0.8865, expected to provide support.
The USD/CHF’s bulls continue to gain momentum and rose towards the 0.8930 area, it highest level since early July. The USD is one of the top performers in the session as it released strong Service sector data, which fueled hawkish bets on the Federal Reserve (Fed). On the Swiss side, nothing relevant will be released today, and the focus is on Friday’s Unemployment figures from August.
The ISM Services PMI from the US came in higher than expected at 54.5, above the consensus of 52.5 and the previous reading of 52.7. The Services sector is holding the US economy afloat and is the last man standing globally, as the European figures came in weak on Tuesday.
As the Federal Reserve (Fed) expects the economy to cool down to contribute to inflation coming down, strong economic figures strengthen the case for another hike this year. In that sense, US year yields are sharply rising, with the 2-year rate rising back to 5%, seeing a 2.40% daily rise. According to the CME FedWatch tool, this rise in bond yields depicts that the odds of a 25 basis point (bps) hike have risen to 44% from nearly 35% in November and December. Those hawkish bets benefit the USD, and its DXY index rose significantly after the release above 105.00.
For the rest of the session, investors will closely monitor the Fed’s Beige book, an important gauge of the US economic activity.
Analysing the daily chart, it is evident that USD/CHF is bullish in the short term. The Relative Strength Index (RSI) is comfortably settled above its midline in positive territory, exhibiting an upward trajectory. Green bars on the Moving Average Convergence Divergence’s (MACD) histogram reinforce the bullish momentum. Plus, the pair is above the 20 and 100-day Simple Moving Averages (SMAs) but below the 200-day SMA, suggesting that the bulls are in command over the bears on the bigger picture.
Support levels: 0.8900, 0.8877 (100-day SMA), 0.8850.
Resistance levels: 0.8950, 0.9000, 0.9030.
Technical Levels: Supports and Resistances
USDCHF currently trading at 0.8923 at the time of writing. Pair opened at 0.8895 and is trading with a change of 0.31 % .
| Overview | Overview.1 | |
|---|---|---|
| 0 | Today last price | 0.8923 |
| 1 | Today Daily Change | 0.0028 |
| 2 | Today Daily Change % | 0.3100 |
| 3 | Today daily open | 0.8895 |
The pair is trading above its 20 Daily moving average @ 0.8809, above its 50 Daily moving average @ 0.878 , above its 100 Daily moving average @ 0.888 and below its 200 Daily moving average @ 0.9061
| Trends | Trends.1 | |
|---|---|---|
| 0 | Daily SMA20 | 0.8809 |
| 1 | Daily SMA50 | 0.8780 |
| 2 | Daily SMA100 | 0.8880 |
| 3 | Daily SMA200 | 0.9061 |
The previous day high was 0.8903 while the previous day low was 0.8842. The daily 38.2% Fib levels comes at 0.888, expected to provide support. Similarly, the daily 61.8% fib level is at 0.8865, expected to provide support.
Note the levels of interest below:
- Pivot support is noted at 0.8857, 0.8819, 0.8796
- Pivot resistance is noted at 0.8918, 0.8941, 0.8979
| Levels | Levels.1 |
|---|---|
| Previous Daily High | 0.8903 |
| Previous Daily Low | 0.8842 |
| Previous Weekly High | 0.8865 |
| Previous Weekly Low | 0.8745 |
| Previous Monthly High | 0.8876 |
| Previous Monthly Low | 0.8690 |
| Daily Fibonacci 38.2% | 0.8880 |
| Daily Fibonacci 61.8% | 0.8865 |
| Daily Pivot Point S1 | 0.8857 |
| Daily Pivot Point S2 | 0.8819 |
| Daily Pivot Point S3 | 0.8796 |
| Daily Pivot Point R1 | 0.8918 |
| Daily Pivot Point R2 | 0.8941 |
| Daily Pivot Point R3 | 0.8979 |
[/s2If]
Download Nehcap EAWe have two EAs that are operational on our LIVE accounts.
- EA-FIX: Check out the details here. Download EA-FIX . EA-FIX is a non-grid HFT scalper.
- EA-GROWTH: High quality low dd EA using trend grids. Download EA_GROWTHJoin Our Telegram Group


