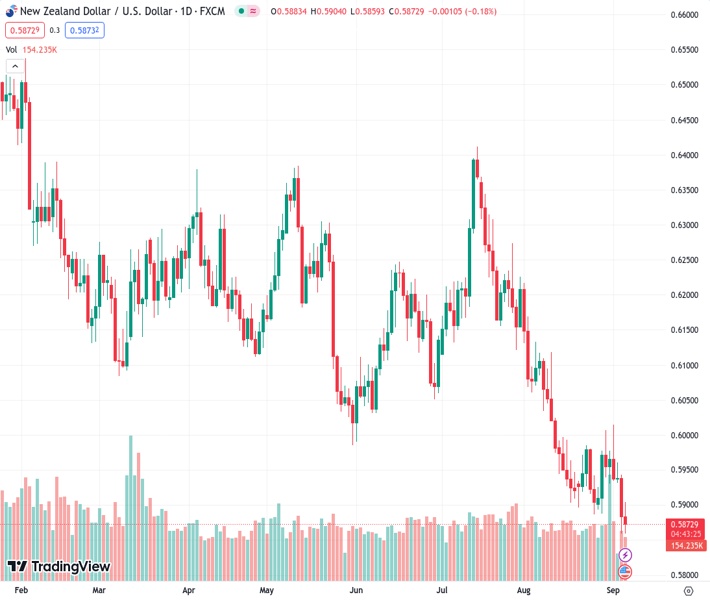
The New Zealand dollar against the US dollar, at a rate of 0.58726, initially saw an increase in value but then lost its gains and dropped back to 0.5870.
…
This is a premium post.
[s2If !current_user_can(access_s2member_level4)]Please register for FREE REGISTER to read full post below containing analysis. In case of any error or you think you are not able to read the full post below, please email us at support#nehcap.com [lwa][/s2If] [s2If current_user_can(access_s2member_level1)]
- The NZD/USD cleared daily gains and retreated to 0.5870.
The pair currently trades last at 0.58726.
The previous day high was 0.595 while the previous day low was 0.5859. The daily 38.2% Fib levels comes at 0.5894, expected to provide resistance. Similarly, the daily 61.8% fib level is at 0.5916, expected to provide resistance.
In Tuesday’s session, the NZD/USD reversed its course and cleared daily gains, which took the pair to a high above 0.5900 and settled near 0.5870. The pair trajectory is mainly driven by the USD’s strength, which gained interest after strong US ISM PMI figures, which strengthened the case of one more hike by the Federal Reserve in this tightening cycle.
Hawkish bets on the Federal Reserve (Fed) got a boost following the release of August’s ISM Service PMIs, which revealed that the sector expanded. The index reached 54.5, above the expected 52.5 and the previous 52.7. Both Chair Powell and several other Fed officials have stated that the next decisions will be taken carefully, analysing incoming data, so strong economic figures may push the Fed to continue tightening as inflation risks arise.
In line with that, the US bond yields are seeing solid increases across the board. The 2-year rate rose to 5%, up by 2.40%, while the 5 and 10-year yields surged to 4.42% and 4.28%, seeing 2.73% and 2.18% daily increases. In that sense, investors seem to be dumping bonds because they are betting on higher odds of another hike by the Fed in this cycle, and the CME FedWatch tool indicates that the probabilities of a 25 basis point (bps) increase in the November meeting, rose back to 44%.
Analysing the daily chart, the NZD/USD presents a bearish outlook for the short term. The Relative Strength Index (RSI) and Moving Average Convergence Divergence (MACD) remain in negative territory, with the RSI positioned below its midline and showcasing a southward slope. Additionally, the MACD displays red bars, further supporting the intensifying bearish momentum. Additionally, the pair is below the 20,100 and 200-day Simple Moving Averages (SMAs), pointing towards the prevailing strength of the bears in the larger context and the buyers facing a challenging situation.
Support levels:0.5858, 0.5830, 0.5800.
Resistance levels: 0.5900, 0.5940 (20-day SMA), 0.5980.
Technical Levels: Supports and Resistances
NZDUSD currently trading at 0.5873 at the time of writing. Pair opened at 0.5883 and is trading with a change of -0.17 % .
| Overview | Overview.1 | |
|---|---|---|
| 0 | Today last price | 0.5873 |
| 1 | Today Daily Change | -0.0010 |
| 2 | Today Daily Change % | -0.1700 |
| 3 | Today daily open | 0.5883 |
The pair remains strongly bearish on the daily time frame. It trades below the 20 SMA @ 0.5951, 50 SMA 0.6093, 100 SMA @ 0.6132 and 200 SMA @ 0.6218.
| Trends | Trends.1 | |
|---|---|---|
| 0 | Daily SMA20 | 0.5951 |
| 1 | Daily SMA50 | 0.6093 |
| 2 | Daily SMA100 | 0.6132 |
| 3 | Daily SMA200 | 0.6218 |
The previous day high was 0.595 while the previous day low was 0.5859. The daily 38.2% Fib levels comes at 0.5894, expected to provide resistance. Similarly, the daily 61.8% fib level is at 0.5916, expected to provide resistance.
Note the levels of interest below:
- Pivot support is noted at 0.5844, 0.5806, 0.5753
- Pivot resistance is noted at 0.5936, 0.5989, 0.6028
| Levels | Levels.1 |
|---|---|
| Previous Daily High | 0.5950 |
| Previous Daily Low | 0.5859 |
| Previous Weekly High | 0.6015 |
| Previous Weekly Low | 0.5887 |
| Previous Monthly High | 0.6219 |
| Previous Monthly Low | 0.5885 |
| Daily Fibonacci 38.2% | 0.5894 |
| Daily Fibonacci 61.8% | 0.5916 |
| Daily Pivot Point S1 | 0.5844 |
| Daily Pivot Point S2 | 0.5806 |
| Daily Pivot Point S3 | 0.5753 |
| Daily Pivot Point R1 | 0.5936 |
| Daily Pivot Point R2 | 0.5989 |
| Daily Pivot Point R3 | 0.6028 |
[/s2If]
Download Nehcap EAWe have two EAs that are operational on our LIVE accounts.
- EA-FIX: Check out the details here. Download EA-FIX . EA-FIX is a non-grid HFT scalper.
- EA-GROWTH: High quality low dd EA using trend grids. Download EA_GROWTHJoin Our Telegram Group


