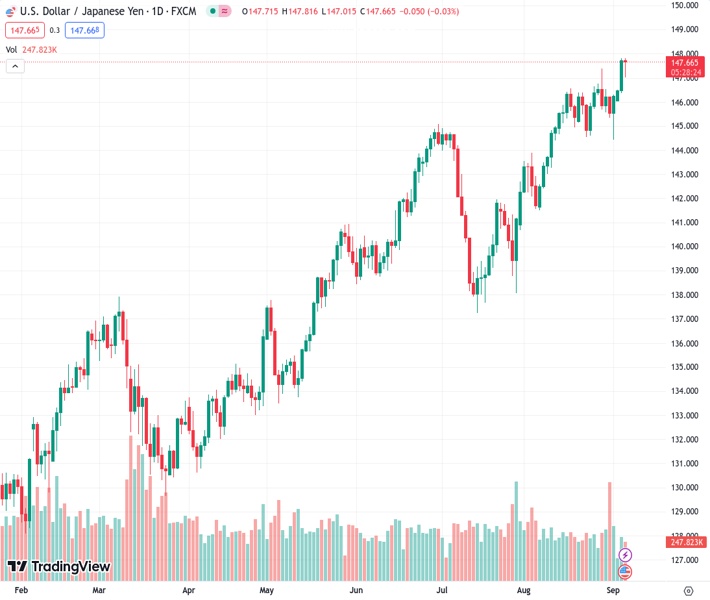
The USDJPY currency pair, which was at 147.643, increases its value following the release of the US ISM Non-Manufacturing PMI for August, which exceeded expectations by recording a reading of 54.5 instead of the anticipated 52.5.
…
This is a premium post.
[s2If !current_user_can(access_s2member_level4)]Please register for FREE REGISTER to read full post below containing analysis. In case of any error or you think you are not able to read the full post below, please email us at support#nehcap.com [lwa][/s2If] [s2If current_user_can(access_s2member_level1)]
- USD/JPY recovers ground after the US ISM Non-Manufacturing PMI for August beats expectations, coming in at 54.5 versus the anticipated 52.5.
The pair currently trades last at 147.643.
The previous day high was 147.8 while the previous day low was 146.41. The daily 38.2% Fib levels comes at 147.27, expected to provide support. Similarly, the daily 61.8% fib level is at 146.94, expected to provide support.
The Greenback (USD) recovered some lost ground against the Japanese Yen (JPY) on Wednesday after data from the United States (US) surprised the markets. That triggered a jump in the USD/JPY, which traders volatile at around 147.30/98, remains negative.
The Institute for Supply Management (ISM) revealed the Non-Manufacturing PMI for August, also called services, which showed that business activity is gaining traction. The reading came at 54.5 from the 52.5 expected and above July’s 52.7. The price index subcomponent rose by 58.9 in August from 56.8 in July.
Even though the latest measures of inflation depict the US Federal Reserve (Fed) job is on track to achieve its 2% goal, the latest report of the Fed’s preferred inflation gauge, PCE, rose by 3.3% in July, a minor setback on its task. Given that and the last ISM report, traders put back on the table a 25 basis point rate hike in November, which would witness the Federal Funds Rate (FFR) reaching the 5.50%-5.75% range.
Consequently, US Treasury bond yields soared, with the 10-year benchmark note rate at 4.296%, gains 10 basis points, while the US Dollar Index reached a seven-month high of 105.024, up 0.21%.
The USD/JPY trimmed some losses after news from the Asian session witnessed Japanese officials considering options amid currency speculation. Hence, market participants and authorities would greatly scrutinize the 148.00/150.00 range, so caution is warranted before placing fresh, long bets on the pair.
The Japanese economic docket would feature a speech by the Bank of Japan’s (BoJ) Nakagawa. On the US front, unemployment claims and speeches by a slew of Fed officials could give some direction on the US central bank’s monetary policy path.
From a technical perspective, the USD/JPY remains upward biased, and it might test the 148.00 figure if not for Japanese authorities threatening to intervene in the FX markets to propel its currency. The next resistance would be the November 1 daily high at 148.82. On the downside, risks emerge at last week’s high-turned support at 147.37, followed by the 147.00 mark. A breach of the latter will expose the Tenkan-Senat 146.12.
Technical Levels: Supports and Resistances
USDJPY currently trading at 147.63 at the time of writing. Pair opened at 147.72 and is trading with a change of -0.06 % .
| Overview | Overview.1 | |
|---|---|---|
| 0 | Today last price | 147.63 |
| 1 | Today Daily Change | -0.09 |
| 2 | Today Daily Change % | -0.06 |
| 3 | Today daily open | 147.72 |
The pair remains strongly bullish on the daily timeframe. It trades above its 20 SMA @ 145.8, 50 SMA 143.36, 100 SMA @ 140.78 and 200 SMA @ 136.91.
| Trends | Trends.1 | |
|---|---|---|
| 0 | Daily SMA20 | 145.80 |
| 1 | Daily SMA50 | 143.36 |
| 2 | Daily SMA100 | 140.78 |
| 3 | Daily SMA200 | 136.91 |
The previous day high was 147.8 while the previous day low was 146.41. The daily 38.2% Fib levels comes at 147.27, expected to provide support. Similarly, the daily 61.8% fib level is at 146.94, expected to provide support.
Note the levels of interest below:
- Pivot support is noted at 146.82, 145.92, 145.43
- Pivot resistance is noted at 148.21, 148.7, 149.6
| Levels | Levels.1 |
|---|---|
| Previous Daily High | 147.80 |
| Previous Daily Low | 146.41 |
| Previous Weekly High | 147.38 |
| Previous Weekly Low | 144.44 |
| Previous Monthly High | 147.38 |
| Previous Monthly Low | 141.51 |
| Daily Fibonacci 38.2% | 147.27 |
| Daily Fibonacci 61.8% | 146.94 |
| Daily Pivot Point S1 | 146.82 |
| Daily Pivot Point S2 | 145.92 |
| Daily Pivot Point S3 | 145.43 |
| Daily Pivot Point R1 | 148.21 |
| Daily Pivot Point R2 | 148.70 |
| Daily Pivot Point R3 | 149.60 |
[/s2If]
Download Nehcap EAWe have two EAs that are operational on our LIVE accounts.
- EA-FIX: Check out the details here. Download EA-FIX . EA-FIX is a non-grid HFT scalper.
- EA-GROWTH: High quality low dd EA using trend grids. Download EA_GROWTHJoin Our Telegram Group


