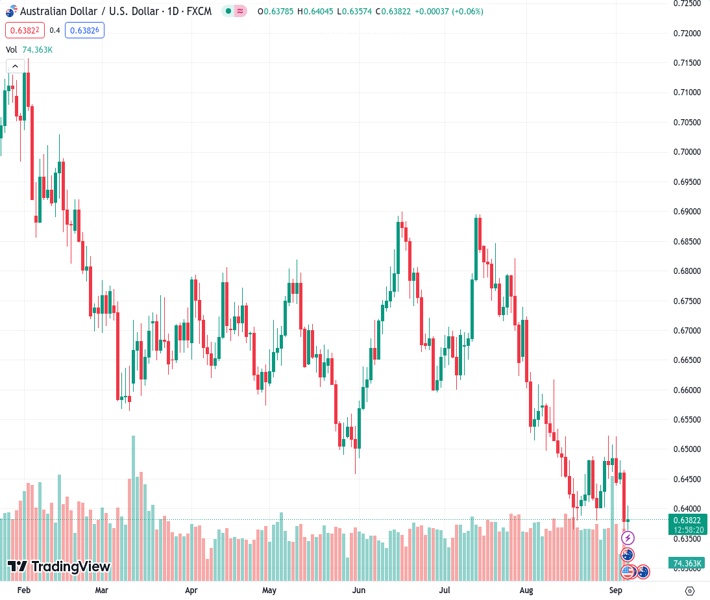
The AUDUSD, trading at 0.63824, experiences a minor improvement from its lowest point this year, but doesn’t continue to gain momentum.
…
This is a premium post.
[s2If !current_user_can(access_s2member_level4)]Please register for FREE REGISTER to read full post below containing analysis. In case of any error or you think you are not able to read the full post below, please email us at support#nehcap.com [lwa][/s2If] [s2If current_user_can(access_s2member_level1)]
- AUD/USD stages a modest recovery from the YTD trough, albeit lacks follow-through.
The pair currently trades last at 0.63824.
The previous day high was 0.6465 while the previous day low was 0.6358. The daily 38.2% Fib levels comes at 0.6399, expected to provide resistance. Similarly, the daily 61.8% fib level is at 0.6424, expected to provide resistance.
The AUD/USD pair finds some support in the vicinity of mid-0.6300s for the second straight day and stages a modest recovery from a fresh low since November 2022 touched this Wednesday. Spot prices, however, struggle to capitalize on the move and remain below the 0.6400 round-figure mark through the early European session.
The US Dollar (USD) takes a brief pause and digests the recent rise to a six-month peak, which, along with the better-than-expected release of the Australian GDP report, prompts some intraday short-covering around the AUD/USD pair. In fact, the Australian Bureau of Statistics reported that the economy expanded by 0.4% during the April-June period, a touch higher than the 0.3% rise anticipated and the 0.2% growth registered in the previous quarter. The yearly rate also surpassed market expectations and came in at 2.1% as compared to the 2.3% seen in the first quarter.
The AUD/USD pair, however, lacks bullish conviction amid concerns about the worsening economic conditions in China. Apart from this, persistent US-China trade tensions keep a lid on the China-proxy Australian Dollar (AUD). In the latest development, US Secretary of Commerce Gina Raimondo said that she doesn’t expect any changes to the US tariffs imposed on China by the Trump administration until the completion of the ongoing review by the US Treasury. This comes on top of expectations that the Reserve Bank of Australia (RBA) is done raising interest rates.
It is worth recalling that the Australian central bank decided to stick to its wait-and-see stance and left the Official Cash Rate (OCR) unchanged at 4.10% for the third straight month on Tuesday. Furthermore, the accompanying monetary policy statement offered little hawkish surprise and fueled speculations that the RBA policy tightening cycle is over. In contrast, the markets are still pricing in the possibility of one more 25 bps rate hike by the Federal Reserve (Fed) in 2023. The outlook remains supportive of elevated US Treasury bond yields and favours the USD bulls.
The aforementioned fundamental backdrop, along with the overnight breakdown through the bearish flag pattern, suggests that the path of least resistance for the AUD/USD pair is to the downside. Hence, any attempted recovery might still be seen as a selling opportunity and runs the risk of fizzling out rather quickly. Traders now look to the release of the US ISM Services PMI, due later during the early North American session. Apart from this, the US bond yields will influence the USD and contribute to producing short-term trading opportunities around the major.
Technical Levels: Supports and Resistances
AUDUSD currently trading at 0.6384 at the time of writing. Pair opened at 0.6379 and is trading with a change of 0.08 % .
| Overview | Overview.1 | |
|---|---|---|
| 0 | Today last price | 0.6384 |
| 1 | Today Daily Change | 0.0005 |
| 2 | Today Daily Change % | 0.0800 |
| 3 | Today daily open | 0.6379 |
The pair remains strongly bearish on the daily time frame. It trades below the 20 SMA @ 0.6451, 50 SMA 0.6596, 100 SMA @ 0.6637 and 200 SMA @ 0.6719.
| Trends | Trends.1 | |
|---|---|---|
| 0 | Daily SMA20 | 0.6451 |
| 1 | Daily SMA50 | 0.6596 |
| 2 | Daily SMA100 | 0.6637 |
| 3 | Daily SMA200 | 0.6719 |
The previous day high was 0.6465 while the previous day low was 0.6358. The daily 38.2% Fib levels comes at 0.6399, expected to provide resistance. Similarly, the daily 61.8% fib level is at 0.6424, expected to provide resistance.
Note the levels of interest below:
- Pivot support is noted at 0.6336, 0.6293, 0.6229
- Pivot resistance is noted at 0.6443, 0.6507, 0.655
| Levels | Levels.1 |
|---|---|
| Previous Daily High | 0.6465 |
| Previous Daily Low | 0.6358 |
| Previous Weekly High | 0.6522 |
| Previous Weekly Low | 0.6401 |
| Previous Monthly High | 0.6724 |
| Previous Monthly Low | 0.6364 |
| Daily Fibonacci 38.2% | 0.6399 |
| Daily Fibonacci 61.8% | 0.6424 |
| Daily Pivot Point S1 | 0.6336 |
| Daily Pivot Point S2 | 0.6293 |
| Daily Pivot Point S3 | 0.6229 |
| Daily Pivot Point R1 | 0.6443 |
| Daily Pivot Point R2 | 0.6507 |
| Daily Pivot Point R3 | 0.6550 |
[/s2If]
Download Nehcap EAWe have two EAs that are operational on our LIVE accounts.
- EA-FIX: Check out the details here. Download EA-FIX . EA-FIX is a non-grid HFT scalper.
- EA-GROWTH: High quality low dd EA using trend grids. Download EA_GROWTHJoin Our Telegram Group


