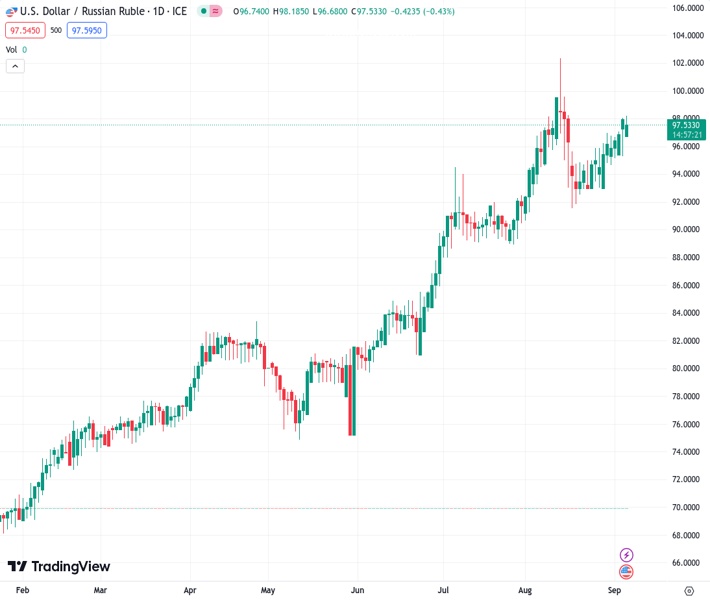
The USD/RUB currency pair, currently at 97.5625, experiences a slowdown in its progress around the 97.70 mark due to the surge in oil prices.
…
This is a premium post.
[s2If !current_user_can(access_s2member_level4)]Please register for FREE REGISTER to read full post below containing analysis. In case of any error or you think you are not able to read the full post below, please email us at support#nehcap.com [lwa][/s2If] [s2If current_user_can(access_s2member_level1)]
- USD/RUB loses momentum near 97.70 amid the rally in oil prices.
The pair currently trades last at 97.5625.
The previous day high was 98.166 while the previous day low was 96.25. The daily 38.2% Fib levels comes at 97.4341, expected to provide support. Similarly, the daily 61.8% fib level is at 96.9819, expected to provide support.
USD/RUB loses ground below the 98.00 mark during the early European session on Wednesday. The pair currently trades around 97.70, up 0.79% on the day.
Russian central bank deputy governor Alexei Zabotkin said on Tuesday that Russia’s economic growth this year will be towards the top end of the 1.5%-2.5% expected range, per Reuters. Furthermore, Russia’s Finance Minister Anton Siluanov forecasted last week that the Russian economy will expand by at least 2.5% in 2023, with inflation hovering around 6%. He also said that he will collaborate with the Central Bank to take all necessary steps to bring down inflation to a sustainable level.
Apart from this, the Russian Ruble gains ground on Wednesday due to a rally in oil prices after the country extends its voluntary oil supply cuts. That said, Saudi Arabia and Russia, the world’s major oil exporters stated that they will extend oil production cuts for the rest of 2023. Russia’s Deputy Prime Minister Alexander Novak said on Tuesday that the nation would reduce its exports by 300,000 barrels per day through the end of 2023.
However, the upside of RUB seems limited as the country has increased its military spending objective for 2023 to more than $100 billion, representing a third of all state expenditure, as the escalating costs of the Ukraine conflict place an increasing strain on Moscow’s finances. This, in turn, might act as a tailwind for the USD/RUB pair.
On the US Dollar front, market participants speculate a 25 basis point (bps) rate increase from the Federal Reserve (Fed) for the entire year, bringing rates to 5.75%, according to the World Interest Rates Probabilities (WIRP) tool. Fed Governor Christopher Waller stated that the Fed has further room to increase interest rates, but the data will determine whether the Fed needs to hike rates again and if it is done hiking rates.
Moving on, market participants will focus on the US ISM Services PMI data due on Wednesday ahead of the weekly Initial Jobless Claims on Thursday. These figures could give a clear direction for USD/RUB. Also, the headline surrounding Russia’s war in Ukraine remains in focus.
Technical Levels: Supports and Resistances
USDRUB currently trading at 60.95 at the time of writing. Pair opened at 96.944 and is trading with a change of -37.13 % .
| Overview | Overview.1 | |
|---|---|---|
| 0 | Today last price | 60.950 |
| 1 | Today Daily Change | -35.994 |
| 2 | Today Daily Change % | -37.130 |
| 3 | Today daily open | 96.944 |
The pair remains strongly bearish on the daily time frame. It trades below the 20 SMA @ 95.9488, 50 SMA 93.0929, 100 SMA @ 87.1042 and 200 SMA @ 79.9455.
| Trends | Trends.1 | |
|---|---|---|
| 0 | Daily SMA20 | 95.9488 |
| 1 | Daily SMA50 | 93.0929 |
| 2 | Daily SMA100 | 87.1042 |
| 3 | Daily SMA200 | 79.9455 |
The previous day high was 98.166 while the previous day low was 96.25. The daily 38.2% Fib levels comes at 97.4341, expected to provide support. Similarly, the daily 61.8% fib level is at 96.9819, expected to provide support.
Note the levels of interest below:
- Pivot support is noted at 96.074, 95.204, 94.158
- Pivot resistance is noted at 97.99, 99.036, 99.906
| Levels | Levels.1 |
|---|---|
| Previous Daily High | 98.1660 |
| Previous Daily Low | 96.2500 |
| Previous Weekly High | 97.0570 |
| Previous Weekly Low | 93.3715 |
| Previous Monthly High | 102.3800 |
| Previous Monthly Low | 90.8215 |
| Daily Fibonacci 38.2% | 97.4341 |
| Daily Fibonacci 61.8% | 96.9819 |
| Daily Pivot Point S1 | 96.0740 |
| Daily Pivot Point S2 | 95.2040 |
| Daily Pivot Point S3 | 94.1580 |
| Daily Pivot Point R1 | 97.9900 |
| Daily Pivot Point R2 | 99.0360 |
| Daily Pivot Point R3 | 99.9060 |
[/s2If]
Download Nehcap EAWe have two EAs that are operational on our LIVE accounts.
- EA-FIX: Check out the details here. Download EA-FIX . EA-FIX is a non-grid HFT scalper.
- EA-GROWTH: High quality low dd EA using trend grids. Download EA_GROWTHJoin Our Telegram Group


