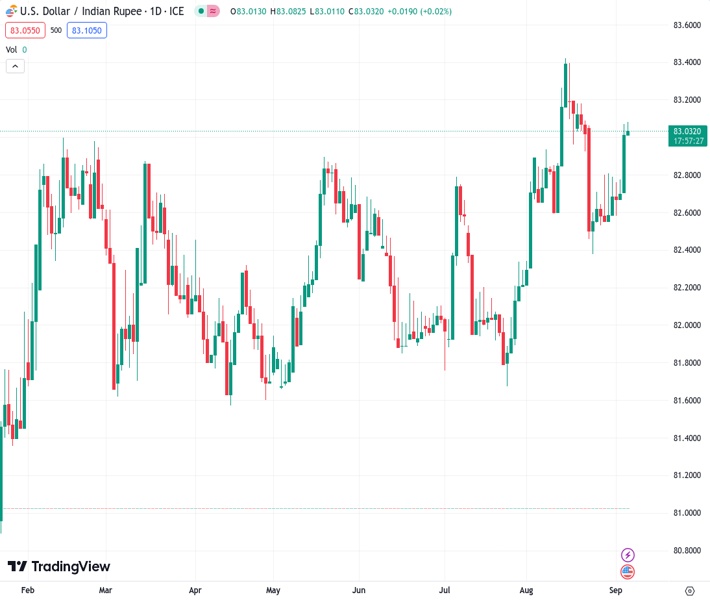
The USD to INR exchange rate of 83.0775 has decreased after reaching the highest level in two weeks. It has also reduced the largest daily increase experienced in the past three weeks.
…
This is a premium post.
[s2If !current_user_can(access_s2member_level4)]Please register for FREE REGISTER to read full post below containing analysis. In case of any error or you think you are not able to read the full post below, please email us at support#nehcap.com [lwa][/s2If] [s2If current_user_can(access_s2member_level1)]
- USD/INR retreats from the highest level in fortnight, pares the biggest daily gains in three weeks.
The pair currently trades last at 83.0775.
The previous day high was 83.2733 while the previous day low was 82.585. The daily 38.2% Fib levels comes at 83.0104, expected to provide support. Similarly, the daily 61.8% fib level is at 82.8479, expected to provide support.
USD/INR pares the biggest daily jump in three weeks while reversing from a fortnight-high to 83.00 during early Wednesday. In doing so, the Indian Rupee (INR) pair traces the US Dollar’s retreat from the multi-day high amid cautious market sentiment ahead of the US ISM Services PMI. Even so, strong Oil prices, fears surrounding China’s economic weakness and the US soft landing, as well as the Sino-American tension, keep the pair buyers hopeful.
India’s heavy reliance on Oil imports drowned the INR the most in three weeks the previous day after the WTI Crude Oil Price refreshed its yearly high to $87.55, around $86.32 by the press time. That said, the black gold rallied after Russia and Saudi Arabia announced the extension of the voluntary supply cuts through the end of 2023. It should be noted that Russia has been a major energy source for India and supply cuts by the nation mean an increase in Oil prices, as well as a wider deficit, which in turn weighs on the Indian Rupee.
Even so, strong Indian growth figures for the second quarter (Q2) prod the Rupee sellers and might have played their role in the latest USD/INR retreat. As per the figures released last week, India’s second quarter (Q2) Gross Domestic Product (GDP) offered a positive surprise the previous week by rising to 7.8% YoY from 6.1% previous readings and 7.7% market forecasts.
Elsewhere, the China-induced risk-off mood joins the mostly upbeat US data and hawkish Fed talks to keep the USD/INR bulls hopeful. That said, China’s downbeat Caixin Services PMI for August, to 51.8 from 54.1 prior flagged economic fears about the Dragon Nation the previous day. Earlier in the day, US Commerce Secretary Gina Raimondo defended the current US tariffs on China until the four-year review is complete, which in turn joins the Taiwan concerns to highlight the Sino-American tension and fuel the pair.
It should be observed that China recently announced a slew of quantitative and qualitative measures to defend the economy from losing the post-COVID-19 recovery but has gained little positive response from the market. Also pushing back the bears was the news suggesting the ability to avoid default by China’s biggest reality player Country Garden.
On the other hand, the US Factory Orders for July dropped to the lowest since mid-2020 while posting -2.1% MoM figures versus -0.1% expectations and 2.3% previous growth. However, the orders excluding transport rose 0.8% MoM, Shipments of goods stayed firmer and inventories marked the first increase in three months.
Despite the mixed US data, Federal Reserve (Fed) Governor Christopher Waller’s defense of hawkish monetary policy during a CNBC interview and Cleveland Federal Reserve President Loretta Mester’s rejection of rate cuts favor the US Dollar bulls. It’s worth noting that Fed’s Waller also added, “Data is looking good for soft landing scenario,” which in turn defends the Fed’s preference for “higher for longer” rates.
Against this backdrop, S&P 500 Futures print mild losses after a downbeat Wall Street close, lacking moves around the 4,500 threshold by the press time, while the benchmark US 10-year Treasury bond yields remain sidelined near 4.26% after rising eight basis points (bps) the previous day.
Moving on, the US ISM Services PMI for August, expected 52.6 versus 52.7 prior, as well as the final readings of the US S&P Global PMIs for the said month, will be important for clear directions of the USD/INR price. Also important to watch will be China headlines and Oil price moves.
Also read: ISM Services PMI Preview: Strength may spook markets, boosting US Dollar
A daily closing beyond the 21-DMA, around 82.90 by the press time, keeps the USD/INR buyers hopeful despite the pair’s latest pullback.
Technical Levels: Supports and Resistances
USDINR currently trading at 83.0394 at the time of writing. Pair opened at 83.1545 and is trading with a change of -0.14% % .
| Overview | Overview.1 | |
|---|---|---|
| 0 | Today last price | 83.0394 |
| 1 | Today Daily Change | -0.1151 |
| 2 | Today Daily Change % | -0.14% |
| 3 | Today daily open | 83.1545 |
The pair remains strongly bullish on the daily timeframe. It trades above its 20 SMA @ 82.9195, 50 SMA 82.5392, 100 SMA @ 82.3738 and 200 SMA @ 82.3005.
| Trends | Trends.1 | |
|---|---|---|
| 0 | Daily SMA20 | 82.9195 |
| 1 | Daily SMA50 | 82.5392 |
| 2 | Daily SMA100 | 82.3738 |
| 3 | Daily SMA200 | 82.3005 |
The previous day high was 83.2733 while the previous day low was 82.585. The daily 38.2% Fib levels comes at 83.0104, expected to provide support. Similarly, the daily 61.8% fib level is at 82.8479, expected to provide support.
Note the levels of interest below:
- Pivot support is noted at 82.7352, 82.316, 82.0469
- Pivot resistance is noted at 83.4235, 83.6926, 84.1118
| Levels | Levels.1 |
|---|---|
| Previous Daily High | 83.2733 |
| Previous Daily Low | 82.5850 |
| Previous Weekly High | 82.8978 |
| Previous Weekly Low | 82.4635 |
| Previous Monthly High | 83.5505 |
| Previous Monthly Low | 82.2240 |
| Daily Fibonacci 38.2% | 83.0104 |
| Daily Fibonacci 61.8% | 82.8479 |
| Daily Pivot Point S1 | 82.7352 |
| Daily Pivot Point S2 | 82.3160 |
| Daily Pivot Point S3 | 82.0469 |
| Daily Pivot Point R1 | 83.4235 |
| Daily Pivot Point R2 | 83.6926 |
| Daily Pivot Point R3 | 84.1118 |
[/s2If]
Download Nehcap EAWe have two EAs that are operational on our LIVE accounts.
- EA-FIX: Check out the details here. Download EA-FIX . EA-FIX is a non-grid HFT scalper.
- EA-GROWTH: High quality low dd EA using trend grids. Download EA_GROWTHJoin Our Telegram Group


