Gold price has continued to stay low for the third consecutive day as it faces downward pressure from a strong US Dollar.
…
This is a premium post.
[s2If !current_user_can(access_s2member_level4)]Please register for FREE REGISTER to read full post below containing analysis. In case of any error or you think you are not able to read the full post below, please email us at support#nehcap.com [lwa][/s2If] [s2If current_user_can(access_s2member_level1)]
- Gold price remains depressed for the third straight day and is pressured by a bullish US Dollar.
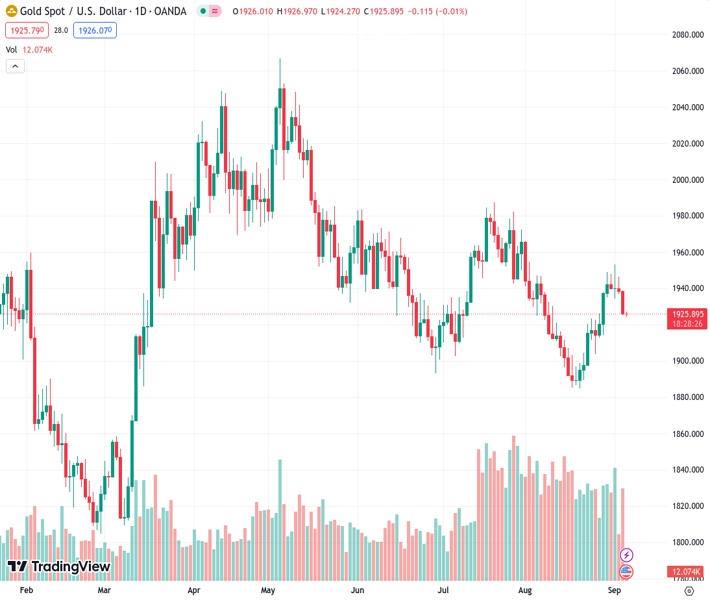
The pair currently trades last at 1925.89.
The previous day high was 1939.02 while the previous day low was 1925.4. The daily 38.2% Fib levels comes at 1930.6, expected to provide resistance. Similarly, the daily 61.8% fib level is at 1933.82, expected to provide resistance.
Gold price trades with a negative bias for the third successive day on Wednesday and retreats further from a nearly one-month top, around the $1,952-$1,953 region touched last week. The XAU/USD slides to over a one-week low during the Asian session, albeit lacks follow-through and is currently placed near the $1,925 level, down less than 0.10% for the day.
Growing acceptance that the Federal Reserve (Fed) will keep interest rates higher for longer lifts the US Dollar (USD) to its highest level since March 10, which, in turn, is seen undermining the Gold price. The Fed is widely expected to pause its rate-hiking cycle at its September monetary policy meeting. The bets were reaffirmed by Fed Governor Christopher Waller on Tuesday, saying that currently there is nothing that will force a move towards boosting the short-term borrowing cost again. That said, the recent macro data from the United States (US) showed that the pace of inflation remains steady and pointed to an extremely resilient economy. This should allow the Fed to keep policy restrictive in the near term.
In fact, the markets are still pricing in the possibility of one more 25 basis points (bps) lift-off by the end of this year. This, in turn, remains supportive of elevated US Treasury bond yields, which continue to lend support to the Greenback and further contribute to a softer tone surrounding the non-yielding Gold price. The downside, however, remains cushioned in the wake of the prevalent cautious market mood, which tends to benefit the precious metal’s safe-haven status. A private survey showed on Tuesday that business activity in China’s services sector expanded at its slowest pace in eight months and fueled concerns about the worsening conditions in the world’s second-largest economy, tempering investors’ appetite for riskier assets.
Apart from this, persistent US-China trade tensions could drive some haven flows towards the Gold price and act as a tailwind. It is worth mentioning that US Secretary of Commerce Gina Raimondo doesn’t expect any changes to the US tariffs imposed on China by the Trump administration until the ongoing review by the US Treasury is complete. This makes it prudent to wait for strong follow-through selling before confirming that the recent recovery from the $1,885 region, or the lowest level since March 13 has run its course and placing aggressive bearish bets around the XAU/USD. Traders now look to the release of the US ISM Services PMI, which might influence the USD price dynamics and provide some impetus to the yellow metal.
Technical Levels: Supports and Resistances
XAUUSD currently trading at 1925.36 at the time of writing. Pair opened at 1925.96 and is trading with a change of -0.03 % .
| Overview | Overview.1 | |
|---|---|---|
| 0 | Today last price | 1925.36 |
| 1 | Today Daily Change | -0.60 |
| 2 | Today Daily Change % | -0.03 |
| 3 | Today daily open | 1925.96 |
The pair is trading above its 20 Daily moving average @ 1915.22, below its 50 Daily moving average @ 1931.81 , below its 100 Daily moving average @ 1952.93 and above its 200 Daily moving average @ 1916.71
| Trends | Trends.1 | |
|---|---|---|
| 0 | Daily SMA20 | 1915.22 |
| 1 | Daily SMA50 | 1931.81 |
| 2 | Daily SMA100 | 1952.93 |
| 3 | Daily SMA200 | 1916.71 |
The previous day high was 1939.02 while the previous day low was 1925.4. The daily 38.2% Fib levels comes at 1930.6, expected to provide resistance. Similarly, the daily 61.8% fib level is at 1933.82, expected to provide resistance.
Note the levels of interest below:
- Pivot support is noted at 1921.23, 1916.51, 1907.61
- Pivot resistance is noted at 1934.85, 1943.75, 1948.47
| Levels | Levels.1 |
|---|---|
| Previous Daily High | 1939.02 |
| Previous Daily Low | 1925.40 |
| Previous Weekly High | 1953.01 |
| Previous Weekly Low | 1912.84 |
| Previous Monthly High | 1966.08 |
| Previous Monthly Low | 1884.85 |
| Daily Fibonacci 38.2% | 1930.60 |
| Daily Fibonacci 61.8% | 1933.82 |
| Daily Pivot Point S1 | 1921.23 |
| Daily Pivot Point S2 | 1916.51 |
| Daily Pivot Point S3 | 1907.61 |
| Daily Pivot Point R1 | 1934.85 |
| Daily Pivot Point R2 | 1943.75 |
| Daily Pivot Point R3 | 1948.47 |
[/s2If]
Download Nehcap EAWe have two EAs that are operational on our LIVE accounts.
- EA-FIX: Check out the details here. Download EA-FIX . EA-FIX is a non-grid HFT scalper.
- EA-GROWTH: High quality low dd EA using trend grids. Download EA_GROWTHJoin Our Telegram Group


