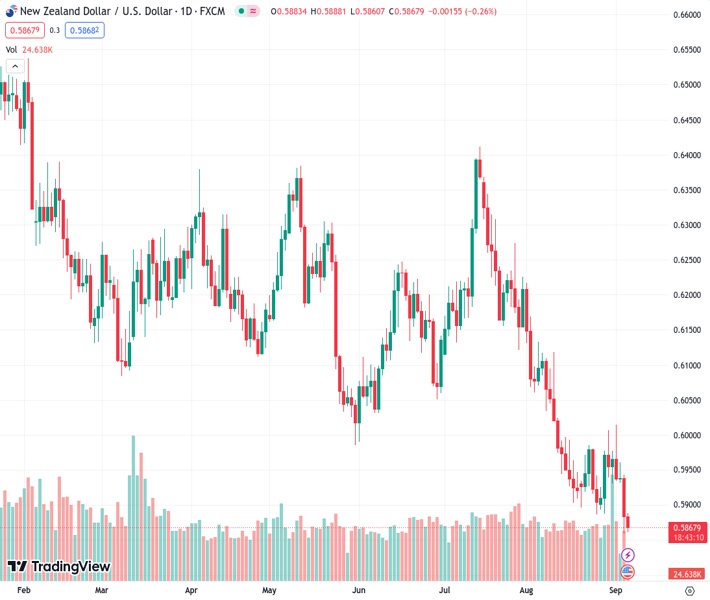
The New Zealand Dollar to US Dollar exchange rate is currently at 0.58692 and has declined to approximately 0.5860 because of the strengthening of the US Dollar.
…
This is a premium post.
[s2If !current_user_can(access_s2member_level4)]Please register for FREE REGISTER to read full post below containing analysis. In case of any error or you think you are not able to read the full post below, please email us at support#nehcap.com [lwa][/s2If] [s2If current_user_can(access_s2member_level1)]
- NZD/USD trades lower around 0.5860 due to firmer US Dollar (USD).
The pair currently trades last at 0.58692.
The previous day high was 0.595 while the previous day low was 0.5859. The daily 38.2% Fib levels comes at 0.5894, expected to provide resistance. Similarly, the daily 61.8% fib level is at 0.5916, expected to provide resistance.
NZD/USD trades lower around 0.5860 during the Asian session on Wednesday, continuing the losing streak that began on Friday. The pair is under pressure due to the firmer US Dollar (USD) as the market participants seem to accept the less likelihood of an interest rate hike by the US Federal Reserve (Fed) in September’s policy meeting.
According to the CME FedWatch Tool, the probability is 93% of an interest rate remaining unchanged. Further, Fed Governor Christopher Waller mentioned to CNBC that the interest rate decision would be contingent on the data. Waller’s statement about the data pointing toward a promising soft-landing scenario has contributed to the strengthening of the US Dollar (USD).
US Dollar Index (DXY), which compares the Greenback against six other major currencies, trades higher around 104.90 at the time of writing. The upbeat yields on US Treasury bonds bolster the buck to continue gaining its strength. The 10-year US Treasury yield rose to 4.26%, up by 1.85%.
United States (US) Factory Orders for July plummeted to their lowest levels since mid-2020, with a decline of -2.1%, far below the market expectations of -0.1% figure, and swinging from the 2.3% growth seen in the previous month.
On Tuesday, China’s downbeat Caixin Services PMI weakened the market optimism and weighed on the NZD/USD pair. China’s services sector experienced its slowest growth in eight months. The data showed a decline from 54.1 in July to 51.8 in August.
Market participants will likely monitor the upcoming data scheduled to be released later in the day. These datasets include US ISM Services PMI for August and US S&P Global PMIs are due. These releases will offer insights into the US economic scenario.
Technical Levels: Supports and Resistances
NZDUSD currently trading at 0.5863 at the time of writing. Pair opened at 0.5883 and is trading with a change of -0.34 % .
| Overview | Overview.1 | |
|---|---|---|
| 0 | Today last price | 0.5863 |
| 1 | Today Daily Change | -0.0020 |
| 2 | Today Daily Change % | -0.3400 |
| 3 | Today daily open | 0.5883 |
The pair remains strongly bearish on the daily time frame. It trades below the 20 SMA @ 0.5951, 50 SMA 0.6093, 100 SMA @ 0.6132 and 200 SMA @ 0.6218.
| Trends | Trends.1 | |
|---|---|---|
| 0 | Daily SMA20 | 0.5951 |
| 1 | Daily SMA50 | 0.6093 |
| 2 | Daily SMA100 | 0.6132 |
| 3 | Daily SMA200 | 0.6218 |
The previous day high was 0.595 while the previous day low was 0.5859. The daily 38.2% Fib levels comes at 0.5894, expected to provide resistance. Similarly, the daily 61.8% fib level is at 0.5916, expected to provide resistance.
Note the levels of interest below:
- Pivot support is noted at 0.5844, 0.5806, 0.5753
- Pivot resistance is noted at 0.5936, 0.5989, 0.6028
| Levels | Levels.1 |
|---|---|
| Previous Daily High | 0.5950 |
| Previous Daily Low | 0.5859 |
| Previous Weekly High | 0.6015 |
| Previous Weekly Low | 0.5887 |
| Previous Monthly High | 0.6219 |
| Previous Monthly Low | 0.5885 |
| Daily Fibonacci 38.2% | 0.5894 |
| Daily Fibonacci 61.8% | 0.5916 |
| Daily Pivot Point S1 | 0.5844 |
| Daily Pivot Point S2 | 0.5806 |
| Daily Pivot Point S3 | 0.5753 |
| Daily Pivot Point R1 | 0.5936 |
| Daily Pivot Point R2 | 0.5989 |
| Daily Pivot Point R3 | 0.6028 |
[/s2If]
Download Nehcap EAWe have two EAs that are operational on our LIVE accounts.
- EA-FIX: Check out the details here. Download EA-FIX . EA-FIX is a non-grid HFT scalper.
- EA-GROWTH: High quality low dd EA using trend grids. Download EA_GROWTHJoin Our Telegram Group


