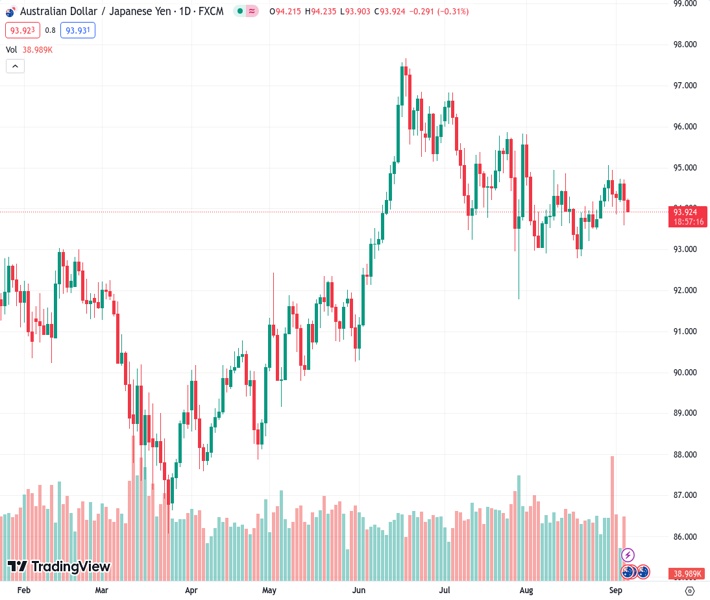
The AUDJPY pair remains low at a value of 93.9300, despite positive growth data from Australia, due to the prevailing negative sentiment in the market.
…
This is a premium post.
[s2If !current_user_can(access_s2member_level4)]Please register for FREE REGISTER to read full post below containing analysis. In case of any error or you think you are not able to read the full post below, please email us at support#nehcap.com [lwa][/s2If] [s2If current_user_can(access_s2member_level1)]
- AUD/JPY stays depressed amid risk-off mood, ignores upbeat Australia growth figures.
The pair currently trades last at 93.9300.
The previous day high was 94.71 while the previous day low was 93.59. The daily 38.2% Fib levels comes at 94.02, expected to provide resistance. Similarly, the daily 61.8% fib level is at 94.28, expected to provide resistance.
AUD/JPY remains pressured for the second consecutive day as sellers attack the 94.00 round figure even after witnessing upbeat Australia growth numbers early Wednesday. In doing so, the cross-currency pair justifies its risk-barometer status amid fears emanating from China.
Australia’s second quarter (Q2) Gross Domestic Product (GDP) rose to 0.4% QoQ versus 0.3% marked expectation and 0.20% prior readings but the yearly figures eased to 2.1% YoY from 2.3% previous readouts, versus the analysts’ estimations of 1.7%.
It’s worth noting that the US 10-year Treasury bond yields remain firmer around 4.27% after rising eight basis points (bps) to 4.26% the previous day, which in turn should have fuelled the AUD/JPY pair. However, fears about China and the Reserve Bank of Australia’s (RBA) dovish halt exert downside pressure on the pair.
That said, fears of China’s economic slowdown and the soft landing in the US roiled the sentiment and fuelled the Greenback. China’s Caixin Services Purchasing Managers’ Index (PMI) for August dropped to the lowest level of the year with 51.8 figures versus 54.1 prior. While giving the details, Dr. Wang Zhe, Senior Economist at Caixin Insight Group said that the gauges for business activity and total new business remained above 50 for the eighth consecutive month, but both readings were lower than in July.
The market’s lack of confidence in the Chinese measures to defend the economy, as well as the recent Sino-American tensions over Taiwan and the US businesses’ discomfort in Beijing, also challenged the market sentiment and weighed on the cross-currency pair.
In doing so, the quote ignores China’s recently announced slew of quantitative and qualitative measures to defend the economy from losing the post-COVID-19 recovery. On the same line was the news suggesting the ability to avoid default by China’s biggest reality player Country Garden.
Earlier in the day, Australian Treasurer Jim Chalmers cited fears of witnessing a significant economic downturn due to China’s economic slowdown and higher rates. The same joins the fears of more US-China tension amid US Treasury Secretary Gina Raimono’s defense of current tariffs on Beijing, to keep the AUD/JPY bears hopeful.
Additionally, fears of Japan’s intervention to defend the Yen, after the Japanese currency reached the yearly low versus the US Dollar, seem to have also weighed on the AUD/JPY price.
While portraying the mood, S&P500 Futures print mild losses by tracking Wall Street’s downbeat close.
Moving on, RBA Governor Lowe’s last speech before resigning will be crucial to watch for clear directions as any signals of policy pivot could drive Aussie further towards the south.
A five-week-old rising wedge formation, currently between 93.70 and 95.10, keeps AUD/JPY bears hopeful.
Technical Levels: Supports and Resistances
AUDJPY currently trading at 94.08 at the time of writing. Pair opened at 94.23 and is trading with a change of -0.16% % .
| Overview | Overview.1 | |
|---|---|---|
| 0 | Today last price | 94.08 |
| 1 | Today Daily Change | -0.15 |
| 2 | Today Daily Change % | -0.16% |
| 3 | Today daily open | 94.23 |
The pair is trading above its 20 Daily moving average @ 94.05, below its 50 Daily moving average @ 94.52 , above its 100 Daily moving average @ 93.41 and above its 200 Daily moving average @ 91.94
| Trends | Trends.1 | |
|---|---|---|
| 0 | Daily SMA20 | 94.05 |
| 1 | Daily SMA50 | 94.52 |
| 2 | Daily SMA100 | 93.41 |
| 3 | Daily SMA200 | 91.94 |
The previous day high was 94.71 while the previous day low was 93.59. The daily 38.2% Fib levels comes at 94.02, expected to provide resistance. Similarly, the daily 61.8% fib level is at 94.28, expected to provide resistance.
Note the levels of interest below:
- Pivot support is noted at 93.64, 93.06, 92.52
- Pivot resistance is noted at 94.76, 95.29, 95.88
| Levels | Levels.1 |
|---|---|
| Previous Daily High | 94.71 |
| Previous Daily Low | 93.59 |
| Previous Weekly High | 95.06 |
| Previous Weekly Low | 93.78 |
| Previous Monthly High | 95.81 |
| Previous Monthly Low | 92.79 |
| Daily Fibonacci 38.2% | 94.02 |
| Daily Fibonacci 61.8% | 94.28 |
| Daily Pivot Point S1 | 93.64 |
| Daily Pivot Point S2 | 93.06 |
| Daily Pivot Point S3 | 92.52 |
| Daily Pivot Point R1 | 94.76 |
| Daily Pivot Point R2 | 95.29 |
| Daily Pivot Point R3 | 95.88 |
[/s2If]
Download Nehcap EAWe have two EAs that are operational on our LIVE accounts.
- EA-FIX: Check out the details here. Download EA-FIX . EA-FIX is a non-grid HFT scalper.
- EA-GROWTH: High quality low dd EA using trend grids. Download EA_GROWTHJoin Our Telegram Group


