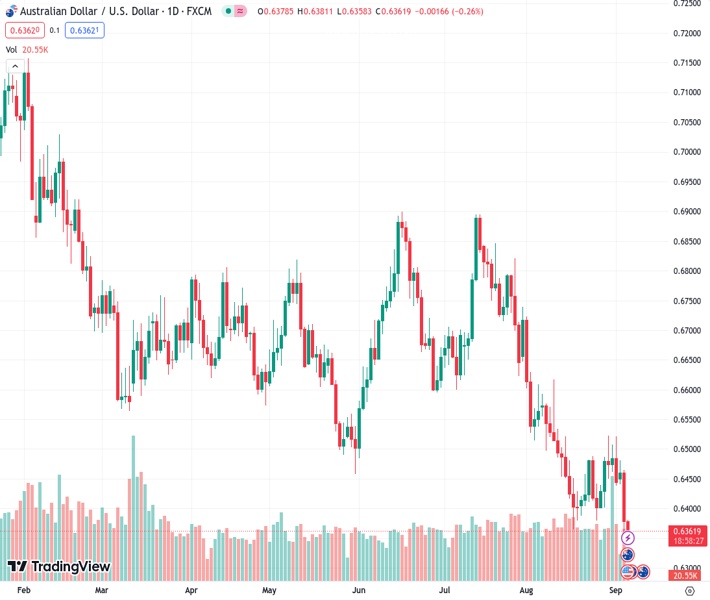
For the second day in a row, the AUDUSD pair at a rate of 0.63603 is still experiencing selling pressure.
…
This is a premium post.
[s2If !current_user_can(access_s2member_level4)]Please register for FREE REGISTER to read full post below containing analysis. In case of any error or you think you are not able to read the full post below, please email us at support#nehcap.com [lwa][/s2If] [s2If current_user_can(access_s2member_level1)]
- AUD/USD remains under some selling pressure for the second successive day on Wednesday.
The pair currently trades last at 0.63603.
The previous day high was 0.6465 while the previous day low was 0.6358. The daily 38.2% Fib levels comes at 0.6399, expected to provide resistance. Similarly, the daily 61.8% fib level is at 0.6424, expected to provide resistance.
The AUD/USD pair fails to capitalize on the overnight modest bounce from the vicinity of mid-0.6300s, or its lowest level since November 2022 and attracts fresh sellers during the Asian session on Wednesday. Spot prices remain depressed near the 0.6360 region and move little in reaction to the better-than-expected Australian GDP report.
In fact, the Australian Bureau of Statistics reported that the economy expanded by 0.4% during the second quarter, more than the 0.2% growth registered in the previous quarter and the 0.3% rise anticipated. The yearly growth rate also surpassed market expectations and came in at 2.1%, though marked a slight slowdown from the 2.3% previous. The data, however, does little to lend any support to the AUD/USD pair amid concerns about the worsening economic conditions in China, which tends to undermine the China-proxy Aussie.
The fears resurfaced after a private survey showed on Tuesday that business activity in China’s services sector expanded at its slowest pace in eight months. Adding to this, US Secretary of Commerce Gina Raimondo doesn’t expect any changes to the US tariffs imposed on China by the Trump administration until the ongoing review by the US Treasury is complete. This, along with the Reserve Bank of Australia’s on-hold rate decision and expectations that the policy tightening cycle is over, continues to undermine the Australian Dollar (AUD).
The US Dollar (USD), on the other hand, climbs to a nearly six-month high and remains well supported by growing acceptance that the Federal Reserve (Fed) will keep interest rates higher for longer. Moreover, the markets are pricing in the possibility of one more 25 bps lift-off in 2023. This, in turn, remains supportive of elevated US Treasury bond yields, which, along with the prevalent cautious market mood favours the USD bulls and suggests that the path of least resistance for the risk-sensitive AUD/USD pair is to the downside.
Technical Levels: Supports and Resistances
AUDUSD currently trading at 0.6372 at the time of writing. Pair opened at 0.6379 and is trading with a change of -0.11 % .
| Overview | Overview.1 | |
|---|---|---|
| 0 | Today last price | 0.6372 |
| 1 | Today Daily Change | -0.0007 |
| 2 | Today Daily Change % | -0.1100 |
| 3 | Today daily open | 0.6379 |
The pair remains strongly bearish on the daily time frame. It trades below the 20 SMA @ 0.6451, 50 SMA 0.6596, 100 SMA @ 0.6637 and 200 SMA @ 0.6719.
| Trends | Trends.1 | |
|---|---|---|
| 0 | Daily SMA20 | 0.6451 |
| 1 | Daily SMA50 | 0.6596 |
| 2 | Daily SMA100 | 0.6637 |
| 3 | Daily SMA200 | 0.6719 |
The previous day high was 0.6465 while the previous day low was 0.6358. The daily 38.2% Fib levels comes at 0.6399, expected to provide resistance. Similarly, the daily 61.8% fib level is at 0.6424, expected to provide resistance.
Note the levels of interest below:
- Pivot support is noted at 0.6336, 0.6293, 0.6229
- Pivot resistance is noted at 0.6443, 0.6507, 0.655
| Levels | Levels.1 |
|---|---|
| Previous Daily High | 0.6465 |
| Previous Daily Low | 0.6358 |
| Previous Weekly High | 0.6522 |
| Previous Weekly Low | 0.6401 |
| Previous Monthly High | 0.6724 |
| Previous Monthly Low | 0.6364 |
| Daily Fibonacci 38.2% | 0.6399 |
| Daily Fibonacci 61.8% | 0.6424 |
| Daily Pivot Point S1 | 0.6336 |
| Daily Pivot Point S2 | 0.6293 |
| Daily Pivot Point S3 | 0.6229 |
| Daily Pivot Point R1 | 0.6443 |
| Daily Pivot Point R2 | 0.6507 |
| Daily Pivot Point R3 | 0.6550 |
[/s2If]
Download Nehcap EAWe have two EAs that are operational on our LIVE accounts.
- EA-FIX: Check out the details here. Download EA-FIX . EA-FIX is a non-grid HFT scalper.
- EA-GROWTH: High quality low dd EA using trend grids. Download EA_GROWTHJoin Our Telegram Group


