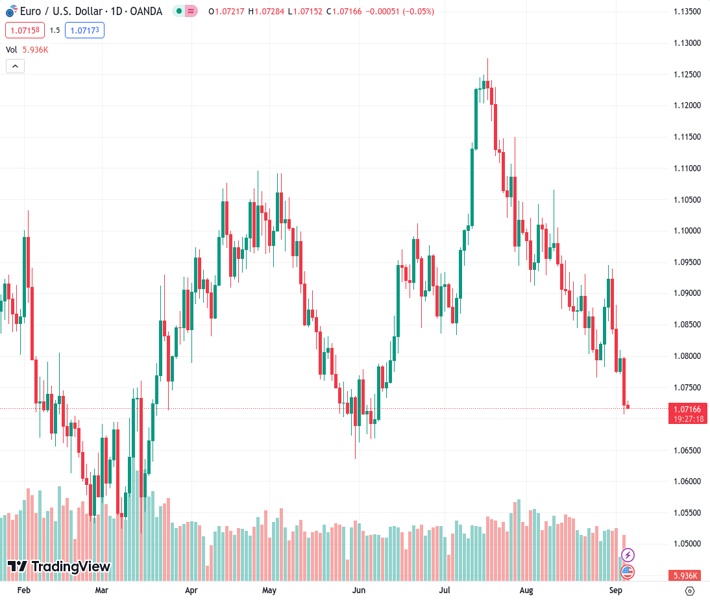
The Euro to US Dollar exchange rate declined to 1.07183 as a result of the Eurozone’s negative economic data.
…
This is a premium post.
[s2If !current_user_can(access_s2member_level4)]Please register for FREE REGISTER to read full post below containing analysis. In case of any error or you think you are not able to read the full post below, please email us at support#nehcap.com [lwa][/s2If] [s2If current_user_can(access_s2member_level1)]
- EUR/USD weakened due to the Eurozone’s downbeat economic data.
The pair currently trades last at 1.07183.
The previous day high was 1.0798 while the previous day low was 1.0706. The daily 38.2% Fib levels comes at 1.0742, expected to provide resistance. Similarly, the daily 61.8% fib level is at 1.0763, expected to provide resistance.
EUR/USD hovers around 1.0720 during the Asian session on Wednesday, treading waters to snap the previous day’s losses. The pair is under pressure due to disappointing data from the Eurozone released on Tuesday.
Eurozone Producer Price Index (PPI) for July reduced to -0.5% on a monthly basis and -7.6% on an annual basis from -0.4% and -3.4% respective priors. Further, HCOB Composite PMI for August declined to 46.7 from the previous reading of 47, which was expected to remain unchanged.
The discouraging statistics have increased the likelihood of the European Central Bank (ECB) shifting away from its hawkish stance due to concerns about a potential recession. This is exerting downward pressure on the EUR/USD currency pair.
ECB President Christine Lagarde advocated that central banks maintain a strong anchor on inflation expectations. In a similar vein, Joachim Nagel, President of the Deutsche Bundesbank and a member of the ECB Council, also offered support for price stability but refrained from offering additional specifics at that time.
Furthermore, The Currency, an Irish business publication, published on Tuesday, an interview with ECB Chief Economist Phillip Lane on August 31. In the interview, Lane commended the softening of the August inflation data. Nevertheless, he emphasized the importance of maintaining such favorable statistics to resist the pressure from the more hawkish members of the ECB.
US Dollar Index (DXY), which compares the Greenback against six other major currencies, trades higher around 104.80 at the time of writing. the upbeat yields on US Treasury bonds help the buck to maintain its strength. The 10-year US Treasury yield rose to 4.26%, up by 1.85%.
However, United States (US) Factory Orders for July plummeted to their lowest levels since mid-2020, with a month-on-month decline of -2.1%, far below the anticipated -0.1%, and swinging from the 2.3% growth seen previously.
Fed Governor Christopher Waller told to CNBC that the decision to raise rates or halt rate increases would be contingent on the data. Waller also stated that data is indicating a favorable outlook for a soft-landing scenario, a sentiment that bolstered the strength of the US Dollar.
Market participants will likely watch the upcoming data scheduled to be released later in the day. These datasets include German Factory Orders and Eurozone Retail Sales for July. On the US docket, the US ISM Services PMI for August and US S&P Global PMIs are due. These releases will offer insights to strategize the bets on the EUR/USD pair.
Technical Levels: Supports and Resistances
EURUSD currently trading at 1.0721 at the time of writing. Pair opened at 1.0722 and is trading with a change of -0.01 % .
| Overview | Overview.1 | |
|---|---|---|
| 0 | Today last price | 1.0721 |
| 1 | Today Daily Change | -0.0001 |
| 2 | Today Daily Change % | -0.0100 |
| 3 | Today daily open | 1.0722 |
The pair remains strongly bearish on the daily time frame. It trades below the 20 SMA @ 1.0865, 50 SMA 1.0961, 100 SMA @ 1.0918 and 200 SMA @ 1.082.
| Trends | Trends.1 | |
|---|---|---|
| 0 | Daily SMA20 | 1.0865 |
| 1 | Daily SMA50 | 1.0961 |
| 2 | Daily SMA100 | 1.0918 |
| 3 | Daily SMA200 | 1.0820 |
The previous day high was 1.0798 while the previous day low was 1.0706. The daily 38.2% Fib levels comes at 1.0742, expected to provide resistance. Similarly, the daily 61.8% fib level is at 1.0763, expected to provide resistance.
Note the levels of interest below:
- Pivot support is noted at 1.0686, 1.065, 1.0594
- Pivot resistance is noted at 1.0778, 1.0834, 1.087
| Levels | Levels.1 |
|---|---|
| Previous Daily High | 1.0798 |
| Previous Daily Low | 1.0706 |
| Previous Weekly High | 1.0946 |
| Previous Weekly Low | 1.0772 |
| Previous Monthly High | 1.1065 |
| Previous Monthly Low | 1.0766 |
| Daily Fibonacci 38.2% | 1.0742 |
| Daily Fibonacci 61.8% | 1.0763 |
| Daily Pivot Point S1 | 1.0686 |
| Daily Pivot Point S2 | 1.0650 |
| Daily Pivot Point S3 | 1.0594 |
| Daily Pivot Point R1 | 1.0778 |
| Daily Pivot Point R2 | 1.0834 |
| Daily Pivot Point R3 | 1.0870 |
[/s2If]
Download Nehcap EAWe have two EAs that are operational on our LIVE accounts.
- EA-FIX: Check out the details here. Download EA-FIX . EA-FIX is a non-grid HFT scalper.
- EA-GROWTH: High quality low dd EA using trend grids. Download EA_GROWTHJoin Our Telegram Group


