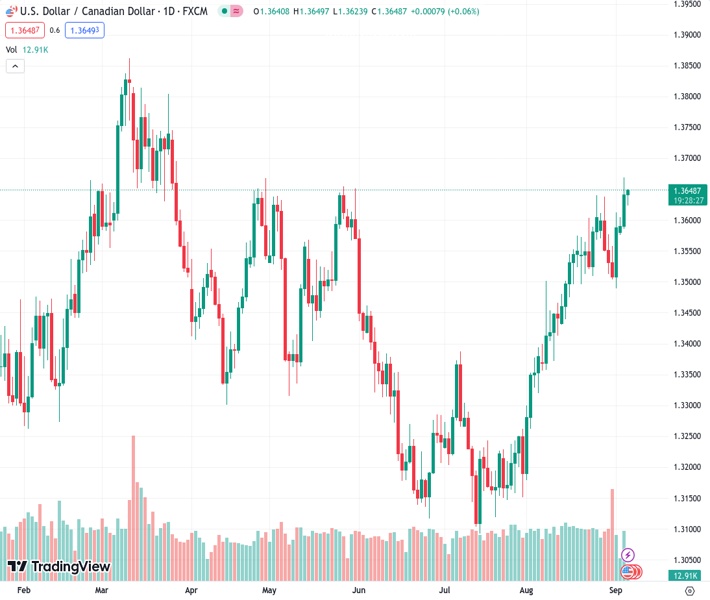
The USD/CAD pair remains strong at its highest level since late March, which was set the previous day.
…
This is a premium post.
[s2If !current_user_can(access_s2member_level4)]Please register for FREE REGISTER to read full post below containing analysis. In case of any error or you think you are not able to read the full post below, please email us at support#nehcap.com [lwa][/s2If] [s2If current_user_can(access_s2member_level1)]
- USD/CAD stays firmer at the highest level since late March, marked the previous day.
The pair currently trades last at 1.36468.
The previous day high was 1.367 while the previous day low was 1.3589. The daily 38.2% Fib levels comes at 1.3639, expected to provide support. Similarly, the daily 61.8% fib level is at 1.362, expected to provide support.
USD/CAD seesaws around 1.3650 as bulls take a breather at the highest level in 2023 ahead of the all-important Bank of Canada (BoC) Interest Rate Decision and the US ISM Services PMI early Wednesday. In doing so, the Loonie pair ignores recently firmer prices of Canada’s key export item, namely the WTI crude oil, while justifying the broad US Dollar strength amid the soft landing concerns.
That said, the WTI crude oil jumped to the highest level since November 2022 the previous day, up 0.30% near $86.95 by the press time, after Russia and Saudi Arabia extended their voluntary production cuts till the end of 2023. With this, the black gold ignores the strong US Dollar and risk-off mood, especially surrounding China.
Elsewhere, the US Dollar Index (DXY) rose to the highest level since mid-March after details of the US Factory Orders joined the broad risk-off mood and hawkish Fed talks. That said, US Factory Orders for July dropped to the lowest since mid-2020 while posting -2.1% MoM figures versus -0.1% expectations and 2.3% previous growth. However, the orders excluding transport rose 0.8% MoM, Shipments of goods stayed firmer and inventories marked the first increase in three months.
It’s worth noting that in the talks about the US central bank signals, Fed Governor Christopher Waller signaled during a CNBC interview that data will drive whether the Fed needs to lift rates again, as well as confirm whether the Fed is done raising rates. The policymaker also added, “Data is looking good for soft landing scenario,” which in turn allowed the US Dollar to remain firmer and fuelled the USD/CAD.
Elsewhere, China’s economic slowdown and the soft landing in the US roiled the sentiment and fuelled the Greenback, which in turn joins the market’s lack of confidence in the Chinese measures to defend the economy, as well as the recent Sino-American tensions over Taiwan and the US businesses’ discomfort in Beijing, also challenged the market sentiment and put a floor under the US Dollar.
Against this backdrop, US 10-year Treasury bond yields rose eight basis points (bps) to 4.26% while Wall Street benchmarks closed with minor losses.
Looking forward, the cautious mood ahead of the US ISM Services PMI and the BoC verdict may keep the USD/CAD pair on a dicey floor. Hence, the Loonie pair may try to pare recent gains should the BoC surprise and the US data disappoint.
Also read: ISM Services PMI Preview: Strength may spook markets, boosting US Dollar
Failure to provide a daily closing beyond April’s peak of around 1.3670 joins the overbought RSI conditions to tease the USD/CAD sellers. However, the Loonie pair’s pullback remains elusive unless breaking the 21-DMA support of around 1.3540. It’s worth noting that a downward-sloping resistance line from October 2022, around 1.3720 by the press time, also acts as the key upside hurdle for the pair buyers to watch.
Technical Levels: Supports and Resistances
USDCAD currently trading at 1.3644 at the time of writing. Pair opened at 1.3642 and is trading with a change of 0.01% % .
| Overview | Overview.1 | |
|---|---|---|
| 0 | Today last price | 1.3644 |
| 1 | Today Daily Change | 0.0002 |
| 2 | Today Daily Change % | 0.01% |
| 3 | Today daily open | 1.3642 |
The pair remains strongly bullish on the daily timeframe. It trades above its 20 SMA @ 1.3536, 50 SMA 1.3364, 100 SMA @ 1.34 and 200 SMA @ 1.3464.
| Trends | Trends.1 | |
|---|---|---|
| 0 | Daily SMA20 | 1.3536 |
| 1 | Daily SMA50 | 1.3364 |
| 2 | Daily SMA100 | 1.3400 |
| 3 | Daily SMA200 | 1.3464 |
The previous day high was 1.367 while the previous day low was 1.3589. The daily 38.2% Fib levels comes at 1.3639, expected to provide support. Similarly, the daily 61.8% fib level is at 1.362, expected to provide support.
Note the levels of interest below:
- Pivot support is noted at 1.3597, 1.3553, 1.3516
- Pivot resistance is noted at 1.3678, 1.3714, 1.3758
| Levels | Levels.1 |
|---|---|
| Previous Daily High | 1.3670 |
| Previous Daily Low | 1.3589 |
| Previous Weekly High | 1.3637 |
| Previous Weekly Low | 1.3489 |
| Previous Monthly High | 1.3640 |
| Previous Monthly Low | 1.3184 |
| Daily Fibonacci 38.2% | 1.3639 |
| Daily Fibonacci 61.8% | 1.3620 |
| Daily Pivot Point S1 | 1.3597 |
| Daily Pivot Point S2 | 1.3553 |
| Daily Pivot Point S3 | 1.3516 |
| Daily Pivot Point R1 | 1.3678 |
| Daily Pivot Point R2 | 1.3714 |
| Daily Pivot Point R3 | 1.3758 |
[/s2If]
Download Nehcap EAWe have two EAs that are operational on our LIVE accounts.
- EA-FIX: Check out the details here. Download EA-FIX . EA-FIX is a non-grid HFT scalper.
- EA-GROWTH: High quality low dd EA using trend grids. Download EA_GROWTHJoin Our Telegram Group


