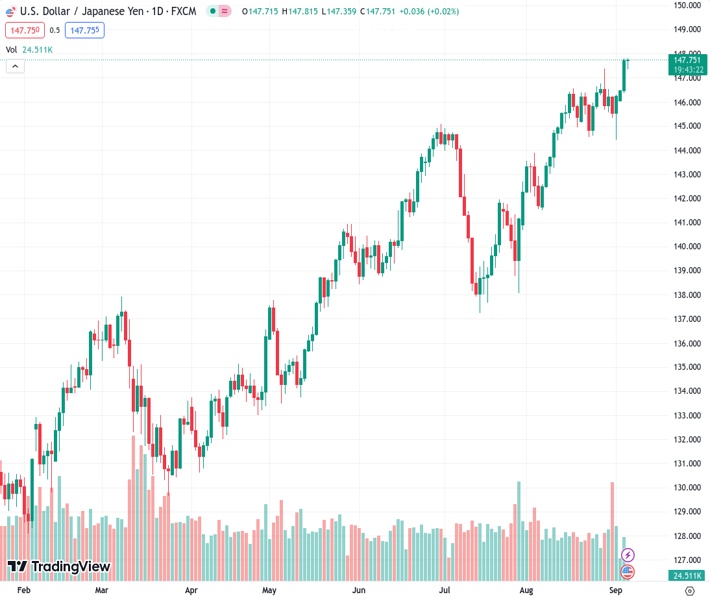
The currency pair USDJPY, trading at 147.728, experiences an increase in interest from buyers looking for a lower price and remains close to its highest point of the year.
…
This is a premium post.
[s2If !current_user_can(access_s2member_level4)]Please register for FREE REGISTER to read full post below containing analysis. In case of any error or you think you are not able to read the full post below, please email us at support#nehcap.com [lwa][/s2If] [s2If current_user_can(access_s2member_level1)]
- USD/JPY attracts some dip-buying on Wednesday and stands tall near the YTD peak.
The pair currently trades last at 147.728.
The previous day high was 147.8 while the previous day low was 146.41. The daily 38.2% Fib levels comes at 147.27, expected to provide support. Similarly, the daily 61.8% fib level is at 146.94, expected to provide support.
The USD/JPY pair reverses an Asian session dip to the 147.35 area and climbs back close to its highest level since November 2022 touched the previous day. Spot prices currently trade around the 147.80 region, though lack bullish conviction amid fears of further jawboning by Japanese authorities.
In fact, Japan’s top currency diplomat Masato Kanda was out with a verbal intervention earlier today and said that authorities won’t rule out any options if speculative moves in the currency market persist. Apart from this, the cautious market mood, undermined by concerns about the worsening economic conditions in China, drives some haven flows towards the Japanese Yen (JPY) and exerts some downward pressure on the USD/JPY pair. The worries resurfaced after a private survey showed on Tuesday that business activity in China’s services sector expanded at its slowest pace in eight months.
Furthermore, US Secretary of Commerce Gina Raimondo downplayed the possibility of any changes to the US tariffs imposed on China by the Trump administration until the ongoing review by the US Treasury is complete. This further tempers investors’ appetite for riskier assets and benefits the JPY. That said, a more dovish stance adopted by the Bank of Japan (BoJ) keeps a lid on the JPY and limits the downside for the USD/JPY pair. In fact, the BoJ is the only central bank in the world to maintain negative interest rates and is expected to stick to its super-easy monetary policy stance.
Moreover, BoJ board member Toyoaki Nakamura indicated recently that it was premature to tighten monetary policy as recent increases in inflation were mostly driven by higher import costs rather than wage gains. This comes after BoJ Governor Kazuo Ueda said that the underlying inflation remains a bit below the 2% target, ensuring the status quo until next summer and marking a big divergence in comparison to the Federal Reserve’s (Fed) hawkish outlook. In fact, the markets are still pricing in the possibility of one more 25 bps Fed rate hike move by the end of this year.
The view that the US central bank will keep rates higher for longer remains supportive of elevated US Treasury bond yields and allows the US Dollar (USD) to stand tall near a six-month peak touched on Tuesday. This, in turn, suggests that the path of least resistance for the USD/JPY pair is to the upside and any meaningful corrective decline might still be seen as a buying opportunity. Traders now look to the US economic docket, featuring the release of the ISM Services PMI, which will influence the USD and provide a fresh impetus to the pair later during the early North American session.
Technical Levels: Supports and Resistances
USDJPY currently trading at 147.7 at the time of writing. Pair opened at 147.72 and is trading with a change of -0.01 % .
| Overview | Overview.1 | |
|---|---|---|
| 0 | Today last price | 147.70 |
| 1 | Today Daily Change | -0.02 |
| 2 | Today Daily Change % | -0.01 |
| 3 | Today daily open | 147.72 |
The pair remains strongly bullish on the daily timeframe. It trades above its 20 SMA @ 145.8, 50 SMA 143.36, 100 SMA @ 140.78 and 200 SMA @ 136.91.
| Trends | Trends.1 | |
|---|---|---|
| 0 | Daily SMA20 | 145.80 |
| 1 | Daily SMA50 | 143.36 |
| 2 | Daily SMA100 | 140.78 |
| 3 | Daily SMA200 | 136.91 |
The previous day high was 147.8 while the previous day low was 146.41. The daily 38.2% Fib levels comes at 147.27, expected to provide support. Similarly, the daily 61.8% fib level is at 146.94, expected to provide support.
Note the levels of interest below:
- Pivot support is noted at 146.82, 145.92, 145.43
- Pivot resistance is noted at 148.21, 148.7, 149.6
| Levels | Levels.1 |
|---|---|
| Previous Daily High | 147.80 |
| Previous Daily Low | 146.41 |
| Previous Weekly High | 147.38 |
| Previous Weekly Low | 144.44 |
| Previous Monthly High | 147.38 |
| Previous Monthly Low | 141.51 |
| Daily Fibonacci 38.2% | 147.27 |
| Daily Fibonacci 61.8% | 146.94 |
| Daily Pivot Point S1 | 146.82 |
| Daily Pivot Point S2 | 145.92 |
| Daily Pivot Point S3 | 145.43 |
| Daily Pivot Point R1 | 148.21 |
| Daily Pivot Point R2 | 148.70 |
| Daily Pivot Point R3 | 149.60 |
[/s2If]
Download Nehcap EAWe have two EAs that are operational on our LIVE accounts.
- EA-FIX: Check out the details here. Download EA-FIX . EA-FIX is a non-grid HFT scalper.
- EA-GROWTH: High quality low dd EA using trend grids. Download EA_GROWTHJoin Our Telegram Group


