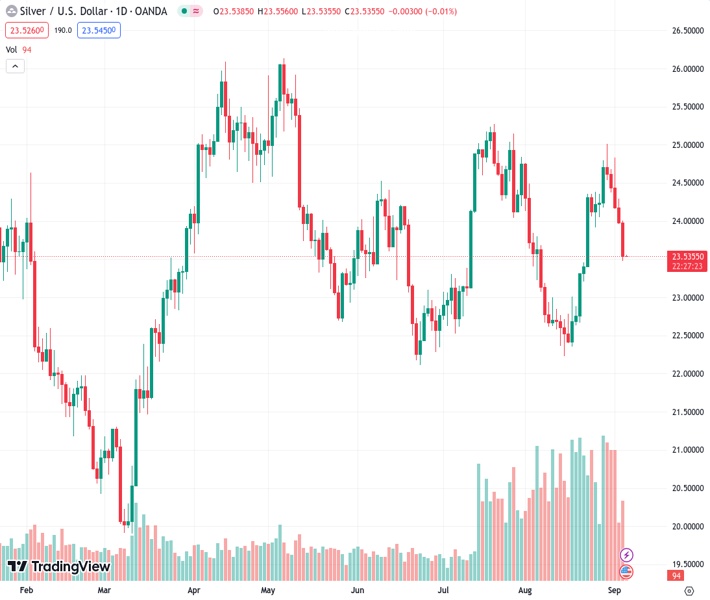
The price of silver, represented by #XAGUSD, dropped below the 50-day Moving Average and ended the day at $23.53.
…
This is a premium post.
[s2If !current_user_can(access_s2member_level4)]Please register for FREE REGISTER to read full post below containing analysis. In case of any error or you think you are not able to read the full post below, please email us at support#nehcap.com [lwa][/s2If] [s2If current_user_can(access_s2member_level1)]
- Silver price falls below the 50-day Moving Average to close at $23.53.
The pair currently trades last at 23.545.
The previous day high was 24.3 while the previous day low was 23.96. The daily 38.2% Fib levels comes at 24.09, expected to provide resistance. Similarly, the daily 61.8% fib level is at 24.17, expected to provide resistance.
Silver price retraces and breaks technical support at the 50-day Moving Average (DMA) on Tuesday after hitting a daily high of $23.99. The $23.71 area was surpassed late in the New York session, which witnessed the white metal printing a daily close of $23.53. At the time of writing, XAG/USD is trading at $23.53, registering minuscule gains of 0.03%.
The XAG/USD price action shows the white metal is tilted to the downside, but the trend is unclear. As of writing, it’s shy of clearing the 200-DMA at $23.46, which is seen as a bearish signal that could make prices tumble. In that case, the first support would be the $23.00 psychological level, followed by the August 15 swing low of $22.23. On the flip side, the XAG/USD first resistance would be the 50-DA at $23.71, followed by the $24.00 mark.
From an intraday perspective, XAG/USD is downward biased, with first support emerging at yesterday’s low of $23.46. Once cleared, the next support would be the S1 daily pivot at $23.34, followed by the S2 pivot point at $23.14. On the flip side, the daily pivot at $23.68 is the first resistance level, followed by the R1 daily pivot at $23.86.
Technical Levels: Supports and Resistances
XAGUSD currently trading at 23.55 at the time of writing. Pair opened at 24.0 and is trading with a change of -1.88 % .
| Overview | Overview.1 | |
|---|---|---|
| 0 | Today last price | 23.55 |
| 1 | Today Daily Change | -0.45 |
| 2 | Today Daily Change % | -1.88 |
| 3 | Today daily open | 24.00 |
The pair is trading above its 20 Daily moving average @ 23.47, below its 50 Daily moving average @ 23.7 , below its 100 Daily moving average @ 23.92 and above its 200 Daily moving average @ 23.44
| Trends | Trends.1 | |
|---|---|---|
| 0 | Daily SMA20 | 23.47 |
| 1 | Daily SMA50 | 23.70 |
| 2 | Daily SMA100 | 23.92 |
| 3 | Daily SMA200 | 23.44 |
The previous day high was 24.3 while the previous day low was 23.96. The daily 38.2% Fib levels comes at 24.09, expected to provide resistance. Similarly, the daily 61.8% fib level is at 24.17, expected to provide resistance.
Note the levels of interest below:
- Pivot support is noted at 23.88, 23.76, 23.55
- Pivot resistance is noted at 24.21, 24.42, 24.54
| Levels | Levels.1 |
|---|---|
| Previous Daily High | 24.30 |
| Previous Daily Low | 23.96 |
| Previous Weekly High | 25.02 |
| Previous Weekly Low | 24.05 |
| Previous Monthly High | 25.02 |
| Previous Monthly Low | 22.23 |
| Daily Fibonacci 38.2% | 24.09 |
| Daily Fibonacci 61.8% | 24.17 |
| Daily Pivot Point S1 | 23.88 |
| Daily Pivot Point S2 | 23.76 |
| Daily Pivot Point S3 | 23.55 |
| Daily Pivot Point R1 | 24.21 |
| Daily Pivot Point R2 | 24.42 |
| Daily Pivot Point R3 | 24.54 |
[/s2If]
Download Nehcap EAWe have two EAs that are operational on our LIVE accounts.
- EA-FIX: Check out the details here. Download EA-FIX . EA-FIX is a non-grid HFT scalper.
- EA-GROWTH: High quality low dd EA using trend grids. Download EA_GROWTHJoin Our Telegram Group


