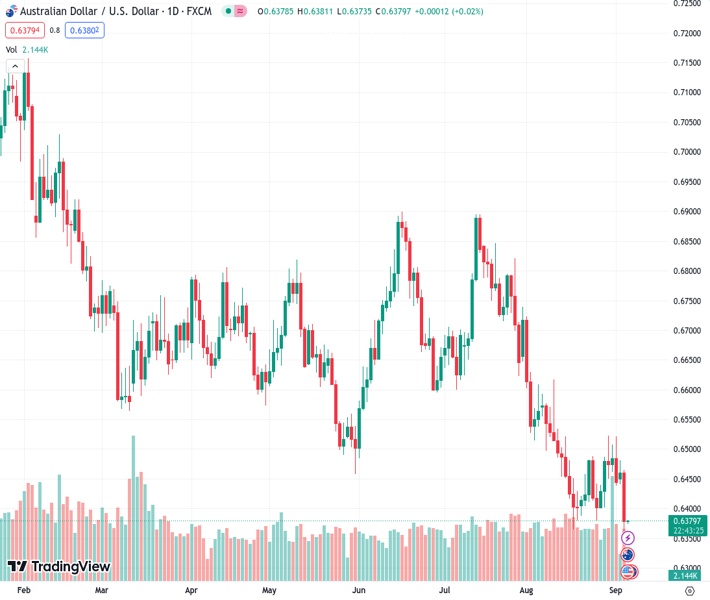
The AUDUSD currency pair, currently at a rate of 0.63809, remains at its lowest point of the year after experiencing a significant decline, the largest in five weeks, on the previous day.
…
This is a premium post.
[s2If !current_user_can(access_s2member_level4)]Please register for FREE REGISTER to read full post below containing analysis. In case of any error or you think you are not able to read the full post below, please email us at support#nehcap.com [lwa][/s2If] [s2If current_user_can(access_s2member_level1)]
- AUD/USD holds lower grounds at yearly bottom after falling the most in five weeks the previous day.
The pair currently trades last at 0.63809.
The previous day high was 0.648 while the previous day low was 0.6445. The daily 38.2% Fib levels comes at 0.6467, expected to provide resistance. Similarly, the daily 61.8% fib level is at 0.6458, expected to provide resistance.
AUD/USD bears lick their wounds at the lowest level in 2023 after falling the most in five weeks as traders await Australia’s second quarter (Q2) Gross Domestic Product (GDP) details on early Wednesday. That said, the Aussie pair seesaws near 0.6380 after falling to 0.6357, the lowest since November 2022 on multiple catalysts.
Be it China’s disappointing data or the Reserve Bank of Australia’s (RBA) dovish halt, not to forget the broad US Dollar strength amid firmer yields and mostly upbeat statistics at home, everything contributed to the AUD/USD pair’s slump the previous day. However, the market’s consolidation ahead of the Aussie Q2 GDP, US ISM Services PMI and RBA Governor Philip Lowe’s last speech before leaving the designation seem to help the pair sellers take a breather.
On Tuesday, the Reserve Bank of Australia (RBA) matched market forecasts by keeping the benchmark rates unchanged at 4.10% while suggesting, via the RBA Rate Statement, that inflation appears peaking. It’s worth noting, however, that the statements suggesting Australia’s below-trend growth and expectations supporting the continuation of the same pattern for a while also seemed to have drowned the Australian Dollar (AUD) afterward.
Further Australia’s S&P Global Composite PMI and Services PMI rose to 48.0 and 47.8 versus 47.1 and 46.7 respective priors but failed to impress the Aussie pair buyers.
Elsewhere, China’s Caixin Services Purchasing Managers’ Index (PMI) for August dropped to the lowest level of the year with the 51.8 figures versus 54.1 prior. While giving the details, Dr. Wang Zhe, Senior Economist at Caixin Insight Group said that the gauges for business activity and total new business remained above 50 for the eighth consecutive month, but both readings were lower than in July.
It’s worth observing that the market’s lack of confidence in the Chinese measures to defend the economy, as well as the recent Sino-American tensions over Taiwan and the US businesses’ discomfort in Beijing, also challenged the market sentiment and put a floor under the US Dollar.
That said, China recently announced a slew of quantitative and qualitative measures to defend the economy from losing the post-COVID-19 recovery. On the same line was the news suggesting the ability to avoid default by China’s biggest reality player Country Garden.
Talking about the US data, US Factory Orders for July dropped to the lowest since mid-2020 while posting -2.1% MoM figures versus -0.1% expectations and 2.3% previous growth. However, the orders orders excluding transport rose 0.8% MoM, Shipments of goods stayed firmer and inventories marked the first increase in three months.
More importantly, Federal Reserve (Fed) Governor Christopher Waller signaled during a CNBC interview that data will drive whether the Fed needs to lift rates again, as well as confirm whether the Fed is done raising rates. The policymaker also added, “Data is looking good for soft landing scenario,” which in turn allowed the US Dollar to remain firmer.
Against this backdrop, the US Dollar Index (DXY) rose to the highest level since mid-March while tracing the upbeat US Treasury bond yields, which in turn exerted downside pressure on riskier assets like equities, commodities and Antipodeans including the AUD/USD pair.
Looking ahead, the AUD/USD traders should pay close attention to Australia’s Q2 GDP, expected to improve on QoQ to 0.30% from 0.2% but ease to 1.7% YoY from 2.3%. Following that, the US ISM Services PMI for August, expected 52.6 versus 52.7 prior, will be important to watch. Above all, RBA Governor Lowe’s last speech before resigning will be crucial to watch for clear directions as any signals of policy pivot could drive Aussie further towards the south.
A clear downside break of three-week-old rising support line, now resistance around 0.6410, directs the AUD/USD pair sellers towards a descending support line from early March surrounding 0.6340.
Technical Levels: Supports and Resistances
AUDUSD currently trading at 0.6377 at the time of writing. Pair opened at 0.6462 and is trading with a change of -1.32 % .
| Overview | Overview.1 | |
|---|---|---|
| 0 | Today last price | 0.6377 |
| 1 | Today Daily Change | -0.0085 |
| 2 | Today Daily Change % | -1.3200 |
| 3 | Today daily open | 0.6462 |
The pair remains strongly bearish on the daily time frame. It trades below the 20 SMA @ 0.6459, 50 SMA 0.6602, 100 SMA @ 0.6641 and 200 SMA @ 0.672.
| Trends | Trends.1 | |
|---|---|---|
| 0 | Daily SMA20 | 0.6459 |
| 1 | Daily SMA50 | 0.6602 |
| 2 | Daily SMA100 | 0.6641 |
| 3 | Daily SMA200 | 0.6720 |
The previous day high was 0.648 while the previous day low was 0.6445. The daily 38.2% Fib levels comes at 0.6467, expected to provide resistance. Similarly, the daily 61.8% fib level is at 0.6458, expected to provide resistance.
Note the levels of interest below:
- Pivot support is noted at 0.6444, 0.6427, 0.6409
- Pivot resistance is noted at 0.648, 0.6498, 0.6515
| Levels | Levels.1 |
|---|---|
| Previous Daily High | 0.6480 |
| Previous Daily Low | 0.6445 |
| Previous Weekly High | 0.6522 |
| Previous Weekly Low | 0.6401 |
| Previous Monthly High | 0.6724 |
| Previous Monthly Low | 0.6364 |
| Daily Fibonacci 38.2% | 0.6467 |
| Daily Fibonacci 61.8% | 0.6458 |
| Daily Pivot Point S1 | 0.6444 |
| Daily Pivot Point S2 | 0.6427 |
| Daily Pivot Point S3 | 0.6409 |
| Daily Pivot Point R1 | 0.6480 |
| Daily Pivot Point R2 | 0.6498 |
| Daily Pivot Point R3 | 0.6515 |
[/s2If]
Download Nehcap EAWe have two EAs that are operational on our LIVE accounts.
- EA-FIX: Check out the details here. Download EA-FIX . EA-FIX is a non-grid HFT scalper.
- EA-GROWTH: High quality low dd EA using trend grids. Download EA_GROWTHJoin Our Telegram Group


