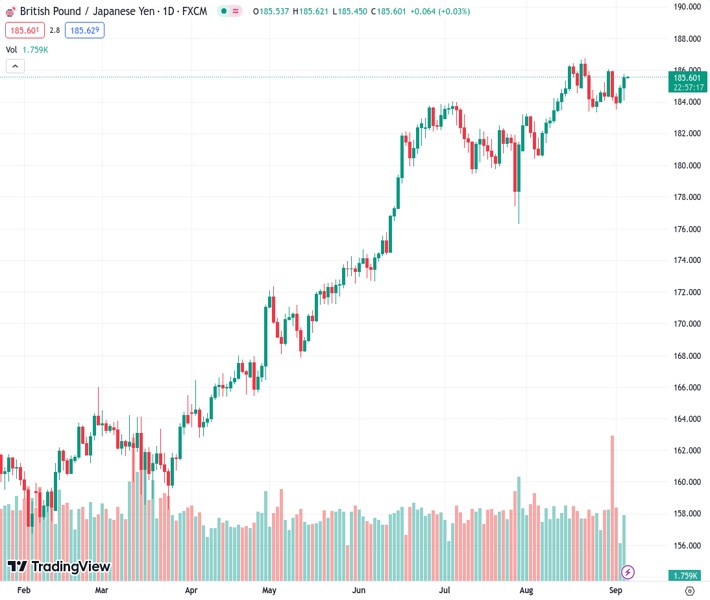
The GBPJPY pair is trading almost unchanged at 185.58, with the US dollar strengthening against the Japanese yen due to increased risk aversion. This has led to a decrease in the value of the yen against most other G8 currencies.
…
This is a premium post.
[s2If !current_user_can(access_s2member_level4)]Please register for FREE REGISTER to read full post below containing analysis. In case of any error or you think you are not able to read the full post below, please email us at support#nehcap.com [lwa][/s2If] [s2If current_user_can(access_s2member_level1)]
- GBP/JPY pair trades nearly flat at 185.58 as risk aversion strengthens the USD/JPY pair, indirectly softening the Yen against most G8 currencies.
The pair currently trades last at 185.595.
The previous day high was 185.09 while the previous day low was 183.85. The daily 38.2% Fib levels comes at 184.61, expected to provide support. Similarly, the daily 61.8% fib level is at 184.32, expected to provide support.
The Pound Sterling (GBP) gained ground against the Japanese Yen (JPY) amid risk aversion, which triggered flows toward the safe-haven status of the Greenback (USD). Hence, strength in the USD/JPY pair weighed on the JPY, which remained soft against most G8 currencies. The GBP/JPY exchanges hands at 185.58, almost flat as the Asian session begins.
The daily chart portrays the pair as upward biased, though it still needs to clear the next resistance seen at the August 30 high at 186.06. An upside break would expose the year-to-date (YTD) high of 186.76 before the GBP/JPY tests 187.00. Conversely, downside risks emerge at the Tenkan-Sen line at 184.70, followed by the Senkou Span at 184.14. Once that area is cleared, the pair’s next stop would be the Kijun-Sen line at 183.58.
In the short term, the GBP/JPY hourly chart portrays the pair as sideways, though slightly tilted upwards. If the pair breaks the August 30 high of 186.06, the R1 daily pivot would be the next resistance at 186.19. A breach of the latter would expose the YTD high at 186.76, shy of the R2 pivot point at 186.84. On the downside, the first support would be the confluence of the daily pivot and the Senkou Span A at 185.17, followed by the psychological 185.00 figure.
Technical Levels: Supports and Resistances
GBPJPY currently trading at 185.61 at the time of writing. Pair opened at 184.9 and is trading with a change of 0.38 % .
| Overview | Overview.1 | |
|---|---|---|
| 0 | Today last price | 185.61 |
| 1 | Today Daily Change | 0.71 |
| 2 | Today Daily Change % | 0.38 |
| 3 | Today daily open | 184.90 |
The pair remains strongly bullish on the daily timeframe. It trades above its 20 SMA @ 184.66, 50 SMA 183.02, 100 SMA @ 177.97 and 200 SMA @ 170.07.
| Trends | Trends.1 | |
|---|---|---|
| 0 | Daily SMA20 | 184.66 |
| 1 | Daily SMA50 | 183.02 |
| 2 | Daily SMA100 | 177.97 |
| 3 | Daily SMA200 | 170.07 |
The previous day high was 185.09 while the previous day low was 183.85. The daily 38.2% Fib levels comes at 184.61, expected to provide support. Similarly, the daily 61.8% fib level is at 184.32, expected to provide support.
Note the levels of interest below:
- Pivot support is noted at 184.14, 183.37, 182.9
- Pivot resistance is noted at 185.38, 185.85, 186.61
| Levels | Levels.1 |
|---|---|
| Previous Daily High | 185.09 |
| Previous Daily Low | 183.85 |
| Previous Weekly High | 186.07 |
| Previous Weekly Low | 183.54 |
| Previous Monthly High | 186.77 |
| Previous Monthly Low | 180.46 |
| Daily Fibonacci 38.2% | 184.61 |
| Daily Fibonacci 61.8% | 184.32 |
| Daily Pivot Point S1 | 184.14 |
| Daily Pivot Point S2 | 183.37 |
| Daily Pivot Point S3 | 182.90 |
| Daily Pivot Point R1 | 185.38 |
| Daily Pivot Point R2 | 185.85 |
| Daily Pivot Point R3 | 186.61 |
[/s2If]
Download Nehcap EAWe have two EAs that are operational on our LIVE accounts.
- EA-FIX: Check out the details here. Download EA-FIX . EA-FIX is a non-grid HFT scalper.
- EA-GROWTH: High quality low dd EA using trend grids. Download EA_GROWTHJoin Our Telegram Group


