At the current exchange rate of 158.397 between the Euro and the Japanese Yen, there is a conflict between sellers and buyers at the 20-day Simple Moving Average (SMA). The purchasers are having difficulty maintaining control and establishing their position above this level.
…
This is a premium post.
[s2If !current_user_can(access_s2member_level4)]Please register for FREE REGISTER to read full post below containing analysis. In case of any error or you think you are not able to read the full post below, please email us at support#nehcap.com [lwa][/s2If] [s2If current_user_can(access_s2member_level1)]
- EUR/JPY bears are presenting a battle to the bulls at the 20-day SMA, with the buyers struggling to consolidate above.
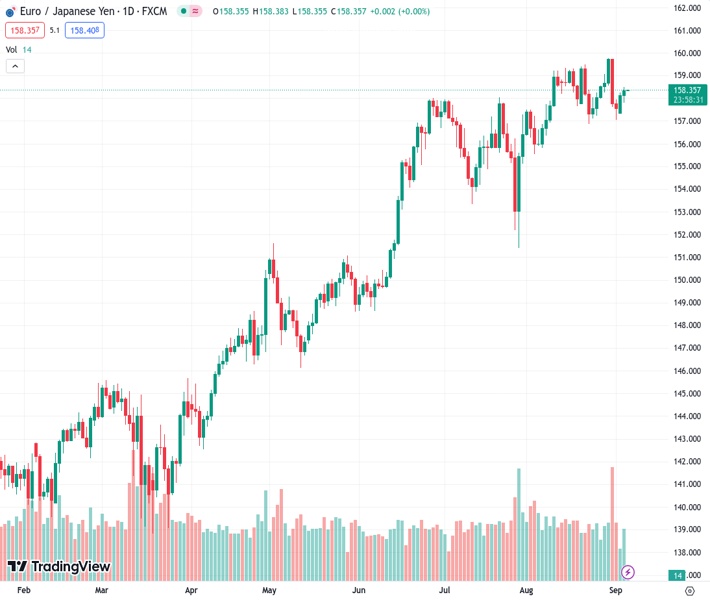
The pair currently trades last at 158.397.
The previous day high was 158.25 while the previous day low was 157.33. The daily 38.2% Fib levels comes at 157.9, expected to provide support. Similarly, the daily 61.8% fib level is at 157.68, expected to provide support.
On Tuesday, the EUR/JPY cross slightly advanced to the 158.36 area over the 20-day Simple Moving Average (SMA), but the buyers struggle to make a significant upward movement.
The technical analysis of the daily chart suggests a neutral to bullish stance for EUR/JPY as the bulls work on recovering their ground and seem to be slow. The Relative Strength Index (RSI) demonstrates a favourable upward trend above its midline, while the Moving Average Convergence (MACD) histogram displays fading red bars.
However, on the four-hour chart, the same indicators show signs of bullish exhaustion, with the RSI turning south and the MACD displaying flat green bars.
Regarding trends, the pair is above the 20,100,200-day Simple Moving Average (SMA), pointing towards the prevailing strength of the bulls in the larger context. However, if the buyers fail to consolidate above the 20-day SMA, another downward leg may be in sight for the pair. On the fundamental’s side, the outlook is more favourable for the EUR, mainly driven by monetary policy divergences between the European Central Bank (ECB) and the Bank of Japan (BoJ).
Support levels: 158.37 (20-day SMA), 158.00, 157.00.
Resistance levels: 159.00, 159.50, 160.00
Technical Levels: Supports and Resistances
EURJPY currently trading at 158.36 at the time of writing. Pair opened at 158.04 and is trading with a change of 0.2 % .
| Overview | Overview.1 | |
|---|---|---|
| 0 | Today last price | 158.36 |
| 1 | Today Daily Change | 0.32 |
| 2 | Today Daily Change % | 0.20 |
| 3 | Today daily open | 158.04 |
The pair remains strongly bullish on the daily timeframe. It trades above its 20 SMA @ 158.35, 50 SMA 157.1, 100 SMA @ 153.58 and 200 SMA @ 148.09.
| Trends | Trends.1 | |
|---|---|---|
| 0 | Daily SMA20 | 158.35 |
| 1 | Daily SMA50 | 157.10 |
| 2 | Daily SMA100 | 153.58 |
| 3 | Daily SMA200 | 148.09 |
The previous day high was 158.25 while the previous day low was 157.33. The daily 38.2% Fib levels comes at 157.9, expected to provide support. Similarly, the daily 61.8% fib level is at 157.68, expected to provide support.
Note the levels of interest below:
- Pivot support is noted at 157.5, 156.96, 156.58
- Pivot resistance is noted at 158.41, 158.79, 159.33
| Levels | Levels.1 |
|---|---|
| Previous Daily High | 158.25 |
| Previous Daily Low | 157.33 |
| Previous Weekly High | 159.76 |
| Previous Weekly Low | 157.06 |
| Previous Monthly High | 159.76 |
| Previous Monthly Low | 155.53 |
| Daily Fibonacci 38.2% | 157.90 |
| Daily Fibonacci 61.8% | 157.68 |
| Daily Pivot Point S1 | 157.50 |
| Daily Pivot Point S2 | 156.96 |
| Daily Pivot Point S3 | 156.58 |
| Daily Pivot Point R1 | 158.41 |
| Daily Pivot Point R2 | 158.79 |
| Daily Pivot Point R3 | 159.33 |
[/s2If]
Download Nehcap EAWe have two EAs that are operational on our LIVE accounts.
- EA-FIX: Check out the details here. Download EA-FIX . EA-FIX is a non-grid HFT scalper.
- EA-GROWTH: High quality low dd EA using trend grids. Download EA_GROWTHJoin Our Telegram Group


