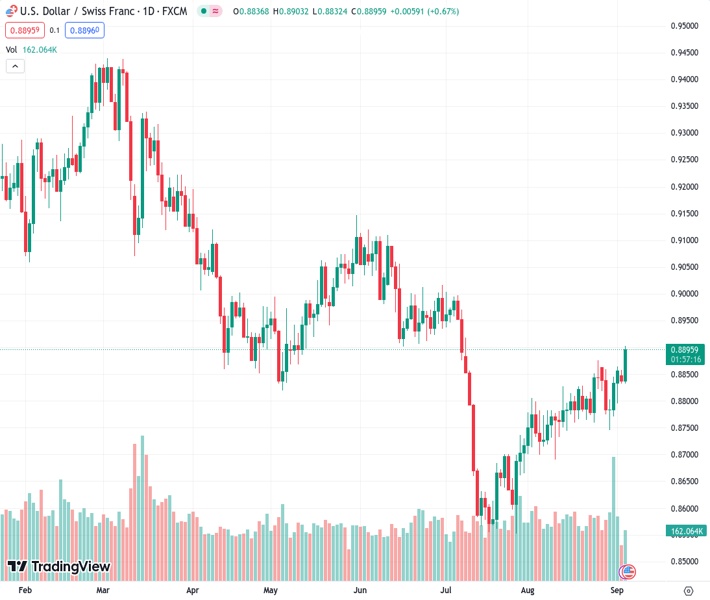
The USDCHF, currently at a rate of 0.88960, has surpassed the 100-day Simple Moving Average (SMA) after a period of trading in a horizontal pattern for one month.
…
This is a premium post.
[s2If !current_user_can(access_s2member_level4)]Please register for FREE REGISTER to read full post below containing analysis. In case of any error or you think you are not able to read the full post below, please email us at support#nehcap.com [lwa][/s2If] [s2If current_user_can(access_s2member_level1)]
- After a month of side-ways trading, the USD/CHF jumped above the 100-day SMA.
The pair currently trades last at 0.88960.
The previous day high was 0.8862 while the previous day low was 0.8833. The daily 38.2% Fib levels comes at 0.8844, expected to provide support. Similarly, the daily 61.8% fib level is at 0.8851, expected to provide support.
The USD/CHF finally saw action after several sessions of sideways trading and jumped above the 100-day Simple Moving Average (SMA) of 0.8880. Despite reporting weak Factory Orders figures from July, the USD traded strongly against most of its rivals.
In line with that, the US DXY index rose to highs since March near 104.80, which a cautious market sentiment could explain as investors await fresh catalysts on a quiet session. Regarding the next Federal Reserve (Fed) decisions, bond yields are trading neutral, with mild gains. At the same time, the World Interest Rates Probabilities (WIRP) tool indicates that market participants are still seeing some probabilities of a 25 basis point (bps) hike for the remainder of the year, which would take rates to 5.75%.
On Tuesday, Christopher Waller from the Fed stated that until inflation comes down, the Fed will have to keep rates at restrictive levels and that one more hike won’t send the economy into a recession. Those hawkish comments contributed to the USD strength.
On the CHF side, the Swiss Q2 Gross Domestic Product (GDP) was reported on Monday to have remained steady and failed to live up to the expectations of a 0.1% increase expected by the markets, which also explains the upward movements of the pair.
Considering the daily chart, USD/CHF presents a neutral to bullish outlook, with the bulls recovering and gaining momentum. The Relative Strength Index (RSI) has a positive slope above its midline, while the Moving Average Convergence (MACD) histogram prints bigger green bars. Additionally, the pair is above the 20 and 100-day Simple Moving Averages (SMAs) but below the 200-day SMA, highlighting the continued dominance of bulls in the broader perspective.
Support levels: 0.8880 (100-day SMA), 0.8800 (20-day SMA), 0.8750.
Resistance levels: 0.8900, 0.8930, 0.8950.
Technical Levels: Supports and Resistances
USDCHF currently trading at 0.8896 at the time of writing. Pair opened at 0.8844 and is trading with a change of 0.59 % .
| Overview | Overview.1 | |
|---|---|---|
| 0 | Today last price | 0.8896 |
| 1 | Today Daily Change | 0.0052 |
| 2 | Today Daily Change % | 0.5900 |
| 3 | Today daily open | 0.8844 |
The pair is trading above its 20 Daily moving average @ 0.8802, above its 50 Daily moving average @ 0.8781 , above its 100 Daily moving average @ 0.888 and below its 200 Daily moving average @ 0.9064
| Trends | Trends.1 | |
|---|---|---|
| 0 | Daily SMA20 | 0.8802 |
| 1 | Daily SMA50 | 0.8781 |
| 2 | Daily SMA100 | 0.8880 |
| 3 | Daily SMA200 | 0.9064 |
The previous day high was 0.8862 while the previous day low was 0.8833. The daily 38.2% Fib levels comes at 0.8844, expected to provide support. Similarly, the daily 61.8% fib level is at 0.8851, expected to provide support.
Note the levels of interest below:
- Pivot support is noted at 0.883, 0.8817, 0.8801
- Pivot resistance is noted at 0.886, 0.8876, 0.8889
| Levels | Levels.1 |
|---|---|
| Previous Daily High | 0.8862 |
| Previous Daily Low | 0.8833 |
| Previous Weekly High | 0.8865 |
| Previous Weekly Low | 0.8745 |
| Previous Monthly High | 0.8876 |
| Previous Monthly Low | 0.8690 |
| Daily Fibonacci 38.2% | 0.8844 |
| Daily Fibonacci 61.8% | 0.8851 |
| Daily Pivot Point S1 | 0.8830 |
| Daily Pivot Point S2 | 0.8817 |
| Daily Pivot Point S3 | 0.8801 |
| Daily Pivot Point R1 | 0.8860 |
| Daily Pivot Point R2 | 0.8876 |
| Daily Pivot Point R3 | 0.8889 |
[/s2If]
Download Nehcap EAWe have two EAs that are operational on our LIVE accounts.
- EA-FIX: Check out the details here. Download EA-FIX . EA-FIX is a non-grid HFT scalper.
- EA-GROWTH: High quality low dd EA using trend grids. Download EA_GROWTHJoin Our Telegram Group


