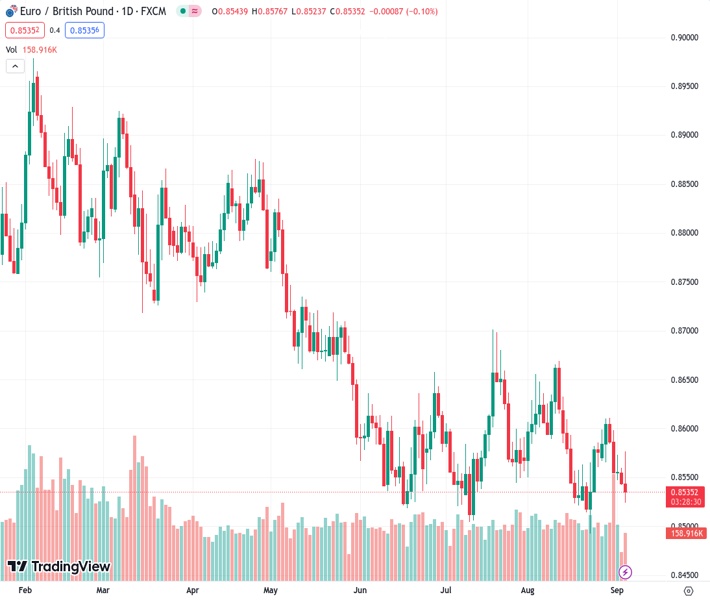
The EURGBP pair, currently standing at 0.85361, has experienced a decline of approximately 0.42% throughout this week and has now dropped to a value of 0.8535.
…
This is a premium post.
[s2If !current_user_can(access_s2member_level4)]Please register for FREE REGISTER to read full post below containing analysis. In case of any error or you think you are not able to read the full post below, please email us at support#nehcap.com [lwa][/s2If] [s2If current_user_can(access_s2member_level1)]
- EUR/GBP lost nearly 0.42% so far this week and fell to 0.8535.
The pair currently trades last at 0.85361.
The previous day high was 0.8564 while the previous day low was 0.8543. The daily 38.2% Fib levels comes at 0.8551, expected to provide resistance. Similarly, the daily 61.8% fib level is at 0.8556, expected to provide resistance.
The EUR/GBP turned south on Tuesday after Services PMIs from the Eurozone from August disappointed investors. On the other hand, the British ones came in higher than expected, benefiting the Pound, while hawkish bets on the Bank of England (BoE) remain steady and provide further cushion to the GBP.
The Producer Price Index (PPI) exceeded expectations in July. The figure came in at -0.5%, higher than the expected decline of -0.6 and beat the previous -0.4%. In addition, the EU S&P Global and Hamburg Commercial Bank (HCOB) Services PMI missed the consensus in August at 47.9, lower than the expected figure of 48.3 and lower than the previous 48.3. The German surveys aligned with expectations, with the Services index remaining at 47.3.
As a reaction, tightening expectations on the European Central Bank (ECB) and the German yields remain steady. The 2,5 and 10-year rates are holding their ground at the 3.03%, 2.59% and 2.60% areas with mild gains. Meanwhile, World Interest Rates Probabilities (WIRP) indicates the odds of a 25bps hike in the upcoming Sep 14, 2023 declined to nearly 25%. For the following meetings, the odds of a 25 bps hike in October and December stand at 45% and 60%, and the hawkish bets on the ECB remaining low leave the door for further downside for the EUR.
On the British Side, Global/CIPS Composite PMI from August exceeded expectations and rose to 48.6, higher than the expected figure of 47.9 but lower than the previous 47.9. Still, it remains in contraction territory. Likewise, the Services survey came in at 49.5, higher than the expected figure of 48.7 and lower than the previous 48.7. WIRP suggest that investors still discount that the Bank of England (BoE) will lift rates somewhere between 5.75-6% in this tightening cycle.
Upon analyzing the daily chart, bearish bias is evident for the short term for the EUR/GBP cross. The Relative Strength Index (RSI) resides below its midline in negative territory, exhibiting a southward trajectory. This aligns with a negative signal from Moving Average Convergence Divergence (MACD), as its red bars show, underscoring the growing bearish momentum. Additionally, the pair is below the 20,100 and 200-day Simple Moving Averages (SMAs), indicating that on the broader picture, the bears are still in command, and the buyers have some work to do.
Support levels: 0.8515, 0.8500, 0.8480.
Resistance levels: 0.8570 (20-day SMA), 0.8590, 0.8600.
Technical Levels: Supports and Resistances
EURGBP currently trading at 0.8532 at the time of writing. Pair opened at 0.855 and is trading with a change of -0.21 % .
| Overview | Overview.1 | |
|---|---|---|
| 0 | Today last price | 0.8532 |
| 1 | Today Daily Change | -0.0018 |
| 2 | Today Daily Change % | -0.2100 |
| 3 | Today daily open | 0.8550 |
The pair remains strongly bearish on the daily time frame. It trades below the 20 SMA @ 0.8575, 50 SMA 0.8584, 100 SMA @ 0.8632 and 200 SMA @ 0.8713.
| Trends | Trends.1 | |
|---|---|---|
| 0 | Daily SMA20 | 0.8575 |
| 1 | Daily SMA50 | 0.8584 |
| 2 | Daily SMA100 | 0.8632 |
| 3 | Daily SMA200 | 0.8713 |
The previous day high was 0.8564 while the previous day low was 0.8543. The daily 38.2% Fib levels comes at 0.8551, expected to provide resistance. Similarly, the daily 61.8% fib level is at 0.8556, expected to provide resistance.
Note the levels of interest below:
- Pivot support is noted at 0.8541, 0.8532, 0.8521
- Pivot resistance is noted at 0.8561, 0.8572, 0.8581
| Levels | Levels.1 |
|---|---|
| Previous Daily High | 0.8564 |
| Previous Daily Low | 0.8543 |
| Previous Weekly High | 0.8611 |
| Previous Weekly Low | 0.8548 |
| Previous Monthly High | 0.8669 |
| Previous Monthly Low | 0.8493 |
| Daily Fibonacci 38.2% | 0.8551 |
| Daily Fibonacci 61.8% | 0.8556 |
| Daily Pivot Point S1 | 0.8541 |
| Daily Pivot Point S2 | 0.8532 |
| Daily Pivot Point S3 | 0.8521 |
| Daily Pivot Point R1 | 0.8561 |
| Daily Pivot Point R2 | 0.8572 |
| Daily Pivot Point R3 | 0.8581 |
[/s2If]
Download Nehcap EAWe have two EAs that are operational on our LIVE accounts.
- EA-FIX: Check out the details here. Download EA-FIX . EA-FIX is a non-grid HFT scalper.
- EA-GROWTH: High quality low dd EA using trend grids. Download EA_GROWTHJoin Our Telegram Group


