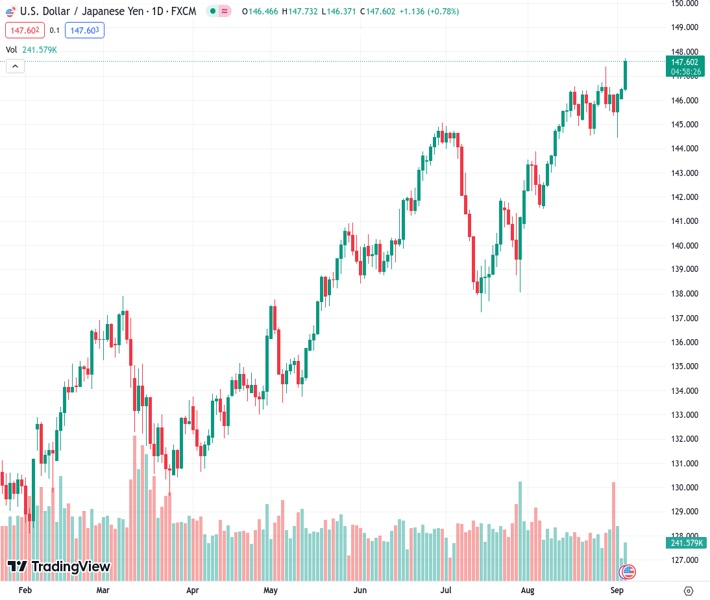
The USDJPY currency pair has risen to its highest level in 10 months at 147.70 due to concerns about risks and an increase in the yield of US 10-year Treasury bonds to 4.261%.
…
This is a premium post.
[s2If !current_user_can(access_s2member_level4)]Please register for FREE REGISTER to read full post below containing analysis. In case of any error or you think you are not able to read the full post below, please email us at support#nehcap.com [lwa][/s2If] [s2If current_user_can(access_s2member_level1)]
- USD/JPY pair reaches a 10-month high of 147.70, driven by risk aversion and a surge in US 10-year Treasury bond yields to 4.261%.
The pair currently trades last at 147.623.
The previous day high was 146.5 while the previous day low was 146.02. The daily 38.2% Fib levels comes at 146.32, expected to provide support. Similarly, the daily 61.8% fib level is at 146.21, expected to provide support.
The Japanese Yen (JPY) fell to a 10-month low against the US Dollar (USD), spurred by risk aversion and a jump in US Treasury bond yields, mainly the 10-year as business activity decelerates worldwide, as revealed by S&P Global. Hence, the USD/JPY is trading at 147.65 after hitting a yearly high of 147.70.
Market sentiment remains downbeat, as China revealed its Caixin Services PMI expanding at a lower rate than estimates of 53.6 at 51.8, and also below the previous month’s reading of 54.1. That triggered fears globally, and investors seeking safety went towards the Greenback and US Treasury bond yields.
Even though Japan reported that business activity for August improved, as revealed by the Jibun Bank Services PMI at 54.3, as expected and above July’s 53.8, it failed to underpin the battered JPY.
On the United States (US) front, after a Labor Day holiday, the docket revealed that Factory Orders for August showed a slight improvement despite plummeting to -2.1%, above estimates of -2.5%. Data from the US Department of Commerce ended a four-month streak of gains.
On the central bank space, the US Federal Reserve board member Christopher Waller stated that recent data gives the US central bank space to decide its next interest rate decision. As of late, Cleveland’s Fed President Loretta Mester said the Fed would not continue to tighten monetary policy until inflation hits 2%, nor wait until it gets there, to lower rates.
In the meantime, US Treasury bond yields continue to trend higher, with the 10-year Treasury bond yield advancing six basis points at 4.261%, a tailwind for the USD/JPY pair. The US Dollar Index (DXY), a measurement of the buck’s performance against six currencies, posted solid gains of 0.61%, at 104.794, its highest level since March 13, 2023.
Upcoming events, like the release of the US ISM Non-Manufacturing PMI for August, is expected to slightly decelerate from 52.7 to 52.5, while the S&P Global Services PMI would likely follow suit, with estimates at 51 from July’s 52.3. If both readings come as expected, the Greenback could be under pressure, as it could reassure the Fed’s pause in September while denting the odds for another interest rate increase in November.
From a daily chart perspective, the USD/JPY remains upward biased as it pushes towards new year-to-date (YTD) highs at around the session. The next stop would be the 148.00 psychological level, followed by last November’s high at 148.82, before challenging 149.00. Conversely, if sellers stepped in, downside risks emerged at the Tenkan-Sen line at 146.09, followed by Senkou Span A at 145.35. A breach of the latter will expose the Kijun-Sen at 144.62 and then the 144.00 mark.
Technical Levels: Supports and Resistances
USDJPY currently trading at 147.67 at the time of writing. Pair opened at 146.49 and is trading with a change of 0.81 % .
| Overview | Overview.1 | |
|---|---|---|
| 0 | Today last price | 147.67 |
| 1 | Today Daily Change | 1.18 |
| 2 | Today Daily Change % | 0.81 |
| 3 | Today daily open | 146.49 |
The pair remains strongly bullish on the daily timeframe. It trades above its 20 SMA @ 145.58, 50 SMA 143.29, 100 SMA @ 140.64 and 200 SMA @ 136.87.
| Trends | Trends.1 | |
|---|---|---|
| 0 | Daily SMA20 | 145.58 |
| 1 | Daily SMA50 | 143.29 |
| 2 | Daily SMA100 | 140.64 |
| 3 | Daily SMA200 | 136.87 |
The previous day high was 146.5 while the previous day low was 146.02. The daily 38.2% Fib levels comes at 146.32, expected to provide support. Similarly, the daily 61.8% fib level is at 146.21, expected to provide support.
Note the levels of interest below:
- Pivot support is noted at 146.18, 145.86, 145.7
- Pivot resistance is noted at 146.65, 146.81, 147.12
| Levels | Levels.1 |
|---|---|
| Previous Daily High | 146.50 |
| Previous Daily Low | 146.02 |
| Previous Weekly High | 147.38 |
| Previous Weekly Low | 144.44 |
| Previous Monthly High | 147.38 |
| Previous Monthly Low | 141.51 |
| Daily Fibonacci 38.2% | 146.32 |
| Daily Fibonacci 61.8% | 146.21 |
| Daily Pivot Point S1 | 146.18 |
| Daily Pivot Point S2 | 145.86 |
| Daily Pivot Point S3 | 145.70 |
| Daily Pivot Point R1 | 146.65 |
| Daily Pivot Point R2 | 146.81 |
| Daily Pivot Point R3 | 147.12 |
[/s2If]
Download Nehcap EAWe have two EAs that are operational on our LIVE accounts.
- EA-FIX: Check out the details here. Download EA-FIX . EA-FIX is a non-grid HFT scalper.
- EA-GROWTH: High quality low dd EA using trend grids. Download EA_GROWTHJoin Our Telegram Group


