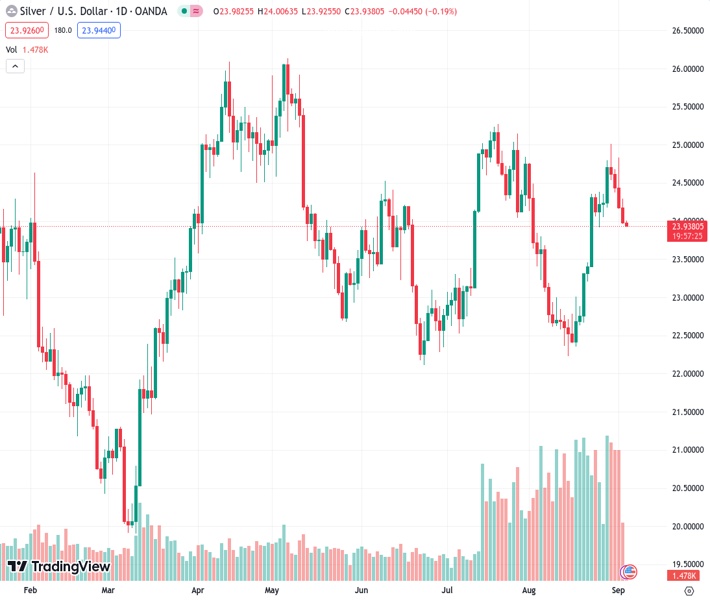
The XAGUSD pair, trading at 23.935, experiences a decrease in silver price, reaching a new low over multiple days. This marks the fifth day in a row of declines. However, it is predicted that there will be a limited decrease in value.
…
This is a premium post.
[s2If !current_user_can(access_s2member_level4)]Please register for FREE REGISTER to read full post below containing analysis. In case of any error or you think you are not able to read the full post below, please email us at support#nehcap.com [lwa][/s2If] [s2If current_user_can(access_s2member_level1)]
- Silver Price takes offers to refresh multi-day low, down for the fifth consecutive day.
The pair currently trades last at 23.935.
The previous day high was 24.3 while the previous day low was 23.96. The daily 38.2% Fib levels comes at 24.09, expected to provide resistance. Similarly, the daily 61.8% fib level is at 24.17, expected to provide resistance.
Silver Price prints five-day losing streak as it refreshes the weekly low around $23.90 amid early Tuesday. In doing so, the bright metal takes clues from the broad US Dollar rebound as the full markets return after the US Labor Day Holiday.
That said, the bright metal’s U-turn from a downward-sloping resistance line from July 19 joins the commodity’s downside break of the 50-SMA to keep the Silver sellers hopeful. Adding strength to the hopes favoring the metal’s south-run are the bearish MACD signals.
It’s worth noting, however, that the RSI (14) line is nearly oversold and hence the downside room appears limited, which in turn highlights the 200-SMA level of $23.75 as the key support.
In a case where the XAG/USD remains bearish past $23.75, the 61.8% Fibonacci retracement of June-July upside, near $23.30, will act as the final defense of the buyers.
On the contrary, an upside clearance of the 50-SMA level surrounding $24.30 could lure the intraday buyers of the XAG/USD.
Following that, the aforementioned resistance line from July, close to $24.65, should check the Silver bulls before giving them control.
Trend: Limited downside expected
Technical Levels: Supports and Resistances
XAGUSD currently trading at 23.94 at the time of writing. Pair opened at 24 and is trading with a change of -0.25% % .
| Overview | Overview.1 | |
|---|---|---|
| 0 | Today last price | 23.94 |
| 1 | Today Daily Change | -0.06 |
| 2 | Today Daily Change % | -0.25% |
| 3 | Today daily open | 24 |
The pair remains strongly bullish on the daily timeframe. It trades above its 20 SMA @ 23.47, 50 SMA 23.7, 100 SMA @ 23.92 and 200 SMA @ 23.44.
| Trends | Trends.1 | |
|---|---|---|
| 0 | Daily SMA20 | 23.47 |
| 1 | Daily SMA50 | 23.70 |
| 2 | Daily SMA100 | 23.92 |
| 3 | Daily SMA200 | 23.44 |
The previous day high was 24.3 while the previous day low was 23.96. The daily 38.2% Fib levels comes at 24.09, expected to provide resistance. Similarly, the daily 61.8% fib level is at 24.17, expected to provide resistance.
Note the levels of interest below:
- Pivot support is noted at 23.88, 23.76, 23.55
- Pivot resistance is noted at 24.21, 24.42, 24.54
| Levels | Levels.1 |
|---|---|
| Previous Daily High | 24.30 |
| Previous Daily Low | 23.96 |
| Previous Weekly High | 25.02 |
| Previous Weekly Low | 24.05 |
| Previous Monthly High | 25.02 |
| Previous Monthly Low | 22.23 |
| Daily Fibonacci 38.2% | 24.09 |
| Daily Fibonacci 61.8% | 24.17 |
| Daily Pivot Point S1 | 23.88 |
| Daily Pivot Point S2 | 23.76 |
| Daily Pivot Point S3 | 23.55 |
| Daily Pivot Point R1 | 24.21 |
| Daily Pivot Point R2 | 24.42 |
| Daily Pivot Point R3 | 24.54 |
[/s2If]
Download Nehcap EAWe have two EAs that are operational on our LIVE accounts.
- EA-FIX: Check out the details here. Download EA-FIX . EA-FIX is a non-grid HFT scalper.
- EA-GROWTH: High quality low dd EA using trend grids. Download EA_GROWTHJoin Our Telegram Group


