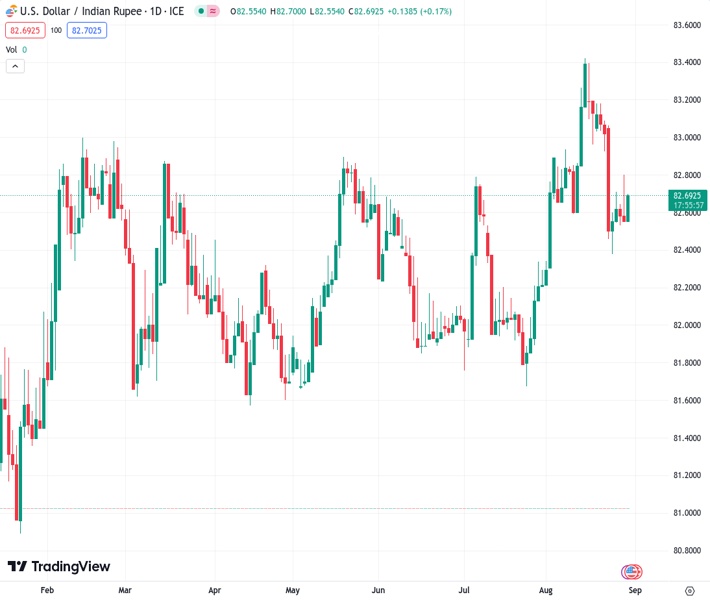
The USD/INR pair remains slightly higher, recovering from a slight decline seen the previous day after reaching a weekly high.
…
This is a premium post.
[s2If !current_user_can(access_s2member_level4)]Please register for FREE REGISTER to read full post below containing analysis. In case of any error or you think you are not able to read the full post below, please email us at support#nehcap.com [lwa][/s2If] [s2If current_user_can(access_s2member_level1)]
- USD/INR sticks to mild gains while reversing the previous day’s pullback from weekly top.
The pair currently trades last at 82.6850.
The previous day high was 82.8978 while the previous day low was 82.563. The daily 38.2% Fib levels comes at 82.6909, expected to provide resistance. Similarly, the daily 61.8% fib level is at 82.7699, expected to provide resistance.
USD/INR prints mild gains around 82.60 as it consolidates the biggest daily fall in a week amid early Wednesday’s market consolidation. That said, the Indian Rupee (INR) pair refreshed the weekly top the previous day before a slump in the US Dollar recalled the bears.
It’s worth noting that the disappointing US data and China-linked optimism weighed on the Greenback price before the latest US Dollar rebound amid the market’s mixed feelings about China and cautious mood before the top-tier data from the US and India.
Talking about China, the Dragon Nation recently conveyed its dislike for the US Commerce Secretary Gina Raimondo’s complaints about the hardships for the US firms in China. Previously, chatters about the early rate cuts from the People’s Bank of China (PBoC) and a cut into the mortgage rates, as well as likely improvement in the US-China ties, favored the market’s optimism.
It should be noted that the International Monetary Fund’s (IMF) readiness to be more cautious while allocating the Special Drawing Rights (SDRs) in the future, due to the current environment of higher interest rates and inflation, also seems to renew the US Dollar’s demand.
Talking about the US data, the Conference Board’s (CB) Consumer Confidence Index gained major attention as it slumped to 106.10 for August from a downwardly revised 114.00 prior (from 117.0), versus 116.0 market forecasts. That said, the US JOLTS Job Openings slumped to the lowest since March 2021, to 8.827M for July versus 9.465M expected and 9.165M prior (revised from 9.582). Additionally, the US Housing Price Index eased to 0.3% MoM for June from 0.7% prior and 0.2% while the S&P/Case-Shiller Home Price Indices improved to -1.2% YoY from -1.7% previous readings and -1.3% market forecasts.
The US statistics became more detrimental for the Greenback as fears of the Fed’s policy pivot in 2023 rallied on Chairman Jerome Powell’s Jackson Hole speech that highlighted the data dependency for future moves. With this, the CME’s FedWatch Tool signaled a 16% chance of a rate hike versus 20% prior. The same propelled Wall Street benchmarks and weighed on the US Treasury bond yields, as well as the US Dollar, before the latest rebound in the US Dollar Index and stabilization of the yields.
Apart from the US Dollar’s rebound, the firmer Crude Oil price also weighs on the Rupee due to India’s reliance on energy imports. That said, the WTI crude oil prods a one-week high near $81.30 by the press time.
Moving on, the US ADP Employment Change, the final readings of the US second quarter (Q2) Gross Domestic Product (GDP) and the Personal Consumption Expenditure (PCE) will direct intraday moves of the USD/INR pair as markets seek more clues to confirm the dovish bias about the Fed.
Following that, India’s Q2 GDP, US Core PCE Price Index and Nonfarm Payrolls (NFP) will be crucial to determine near-term USD/INR moves.
A convergence of the 50-DMA and a one-month-old rising support line, close to 82.45 at the latest, appears a tough nut to crack the USD/INR bears.
Technical Levels: Supports and Resistances
USDINR currently trading at 82.638 at the time of writing. Pair opened at 82.5965 and is trading with a change of 0.05% % .
| Overview | Overview.1 | |
|---|---|---|
| 0 | Today last price | 82.638 |
| 1 | Today Daily Change | 0.0415 |
| 2 | Today Daily Change % | 0.05% |
| 3 | Today daily open | 82.5965 |
The pair is trading below its 20 Daily moving average @ 82.9044, above its 50 Daily moving average @ 82.4514 , above its 100 Daily moving average @ 82.328 and above its 200 Daily moving average @ 82.2713
| Trends | Trends.1 | |
|---|---|---|
| 0 | Daily SMA20 | 82.9044 |
| 1 | Daily SMA50 | 82.4514 |
| 2 | Daily SMA100 | 82.3280 |
| 3 | Daily SMA200 | 82.2713 |
The previous day high was 82.8978 while the previous day low was 82.563. The daily 38.2% Fib levels comes at 82.6909, expected to provide resistance. Similarly, the daily 61.8% fib level is at 82.7699, expected to provide resistance.
Note the levels of interest below:
- Pivot support is noted at 82.4738, 82.351, 82.139
- Pivot resistance is noted at 82.8085, 83.0205, 83.1433
| Levels | Levels.1 |
|---|---|
| Previous Daily High | 82.8978 |
| Previous Daily Low | 82.5630 |
| Previous Weekly High | 83.2100 |
| Previous Weekly Low | 82.3485 |
| Previous Monthly High | 82.8334 |
| Previous Monthly Low | 81.6588 |
| Daily Fibonacci 38.2% | 82.6909 |
| Daily Fibonacci 61.8% | 82.7699 |
| Daily Pivot Point S1 | 82.4738 |
| Daily Pivot Point S2 | 82.3510 |
| Daily Pivot Point S3 | 82.1390 |
| Daily Pivot Point R1 | 82.8085 |
| Daily Pivot Point R2 | 83.0205 |
| Daily Pivot Point R3 | 83.1433 |
[/s2If]
Download Nehcap EAWe have two EAs that are operational on our LIVE accounts.
- EA-FIX: Check out the details here. Download EA-FIX . EA-FIX is a non-grid HFT scalper.
- EA-GROWTH: High quality low dd EA using trend grids. Download EA_GROWTHJoin Our Telegram Group
")


