The GBPUSD currency pair has declined as a result of the rise in US bond yields.
…
This is a premium post.
[s2If !current_user_can(access_s2member_level4)]Please register for FREE REGISTER to read full post below containing analysis. In case of any error or you think you are not able to read the full post below, please email us at support#nehcap.com [lwa][/s2If] [s2If current_user_can(access_s2member_level1)]
- GBP/USD trades lower due to the improvement in US bond yields.
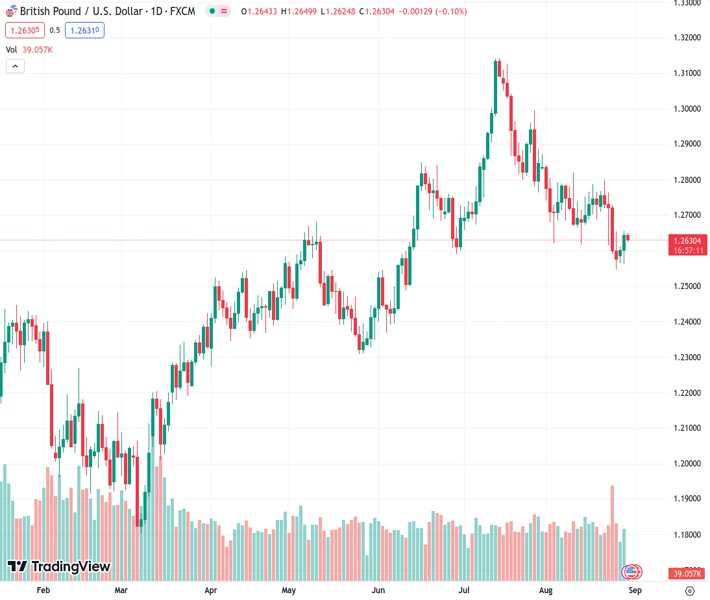
The pair currently trades last at 1.26305.
The previous day high was 1.2655 while the previous day low was 1.2563. The daily 38.2% Fib levels comes at 1.262, expected to provide support. Similarly, the daily 61.8% fib level is at 1.2598, expected to provide support.
GBP/USD trades lower around 1.2630 on the back of a recovery in the US Dollar (USD), which could be attributed to the improvement in US Treasury yields snapping a two-day losing streak. The US Dollar Index (DXY), which measures the performance of the Greenback against the six other major currencies, trades higher around 103.60 at the time of writing during the Asian session.
The US Dollar (USD) is treading waters to retrace from the two-day losses. US Treasury yields fell by 2.04% on Tuesday, which exerted downward pressure on the buck. Currently, the yield on the 10-year US bond trades at 4.13%. Moreover, the disappointing economic data from the United States (US) on Tuesday further solidified the dovish sentiment regarding the Fed’s policy stance. This has contributed to an increase in downward pressure on the GBP/USD pair.
As said, US Consumer Confidence (Aug) fell to 106.1 from 114.0 prior, falling short of the expected 116.0. US JOLTS Job Openings showed a reduction in July, reporting 8.827 million against the previous 9.165 million. This contrasted with the expected rise to 9.465 million.
Investors anticipate a 25 basis points (bps) interest rate hike at the upcoming September’s monetary policy meeting by the Bank of England (BoE). However, there appears to be a sense of caution among investors, as the prospect of additional tightening of monetary policy could potentially have a negative impact on the economic outlook of the United Kingdom (UK).
On the other hand, the CME’s FedWatch Tool currently indicates that the market is pricing an 11.5% likelihood of a rate hike during the upcoming meeting by the US Federal Reserve (Fed). Investors are foreseeing that the Fed will likely delay any rate hikes until its September meeting. This prevailing sentiment is leading to a downward pressure on the value of the Greenback.
Furthermore, at the Jackson Hole Symposium, US Federal Reserve (Fed) Chairman Jerome Powell emphasized that the Fed’s decision regarding the next interest rate hike will be data-driven. Consequently, traders of the GBP/USD pair are currently in a state of anticipation as they await the release of upcoming US economic data.
With a lack of significant data from the UK during the week, investors’ focus has shifted towards gaining a clearer insight into the economic outlook of the United States (US). These upcoming datasets include the US ADP Employment Change for August and the preliminary Gross Domestic Product Annualized for the second quarter (Q2), both of which are scheduled to be released later in the North American trading session.
Technical Levels: Supports and Resistances
GBPUSD currently trading at 1.2629 at the time of writing. Pair opened at 1.2644 and is trading with a change of -0.12 % .
| Overview | Overview.1 | |
|---|---|---|
| 0 | Today last price | 1.2629 |
| 1 | Today Daily Change | -0.0015 |
| 2 | Today Daily Change % | -0.1200 |
| 3 | Today daily open | 1.2644 |
The pair is trading below its 20 Daily moving average @ 1.2702, below its 50 Daily moving average @ 1.2782 , below its 100 Daily moving average @ 1.2644 and above its 200 Daily moving average @ 1.2407
| Trends | Trends.1 | |
|---|---|---|
| 0 | Daily SMA20 | 1.2702 |
| 1 | Daily SMA50 | 1.2782 |
| 2 | Daily SMA100 | 1.2644 |
| 3 | Daily SMA200 | 1.2407 |
The previous day high was 1.2655 while the previous day low was 1.2563. The daily 38.2% Fib levels comes at 1.262, expected to provide support. Similarly, the daily 61.8% fib level is at 1.2598, expected to provide support.
Note the levels of interest below:
- Pivot support is noted at 1.2586, 1.2528, 1.2494
- Pivot resistance is noted at 1.2678, 1.2713, 1.277
| Levels | Levels.1 |
|---|---|
| Previous Daily High | 1.2655 |
| Previous Daily Low | 1.2563 |
| Previous Weekly High | 1.2800 |
| Previous Weekly Low | 1.2548 |
| Previous Monthly High | 1.3142 |
| Previous Monthly Low | 1.2659 |
| Daily Fibonacci 38.2% | 1.2620 |
| Daily Fibonacci 61.8% | 1.2598 |
| Daily Pivot Point S1 | 1.2586 |
| Daily Pivot Point S2 | 1.2528 |
| Daily Pivot Point S3 | 1.2494 |
| Daily Pivot Point R1 | 1.2678 |
| Daily Pivot Point R2 | 1.2713 |
| Daily Pivot Point R3 | 1.2770 |
[/s2If]
Download Nehcap EAWe have two EAs that are operational on our LIVE accounts.
- EA-FIX: Check out the details here. Download EA-FIX . EA-FIX is a non-grid HFT scalper.
- EA-GROWTH: High quality low dd EA using trend grids. Download EA_GROWTHJoin Our Telegram Group
")


