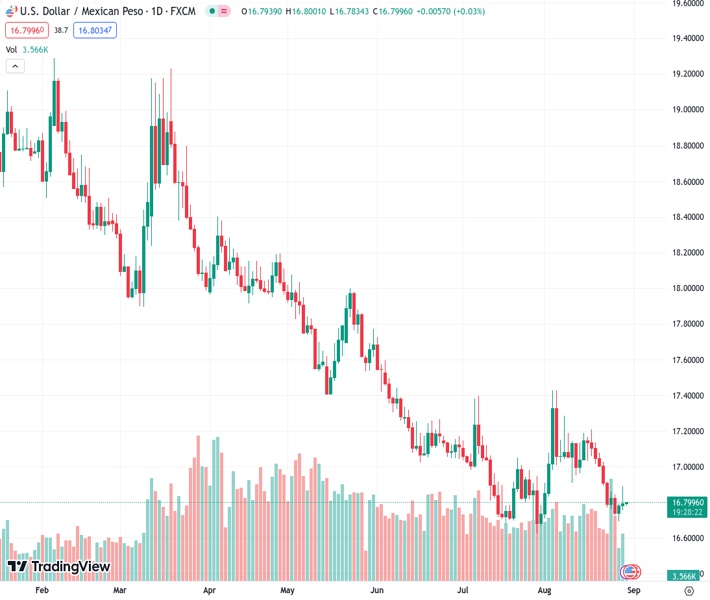
The USDMXN pair, currently at 16.7965, is staying in a neutral position after turning down from its highest point of the week. Nehcap’s perspective on this is pessimistic, expecting a decline in the pair.
…
This is a premium post.
[s2If !current_user_can(access_s2member_level4)]Please register for FREE REGISTER to read full post below containing analysis. In case of any error or you think you are not able to read the full post below, please email us at support#nehcap.com [lwa][/s2If] [s2If current_user_can(access_s2member_level1)]
- USD/MXN remains sidelined after reversing from weekly top.
The pair currently trades last at 16.7965.
The previous day high was 16.8888 while the previous day low was 16.7552. The daily 38.2% Fib levels comes at 16.8378, expected to provide resistance. Similarly, the daily 61.8% fib level is at 16.8062, expected to provide resistance.
USD/MXN struggles for clear directions after reversing from a one-week high the previous day, making rounds to 16.80 during Wednesday’s Asian session. In doing so, the Mexican Peso (MXN) pair justifies the previous day’s Doji candlestick to lure the pair sellers, especially amid the bearish MACD signals and the downbeat RSI (14) line, not oversold.
It’s worth noting, however, that the cautious mood ahead of the top-tier US data prods the momentum traders of late. Among the scheduled US statistics, ADP Employment Change, the final readings of the US second quarter (Q2) Gross Domestic Product (GDP) and the Personal Consumption Expenditure (PCE) are the key to watch.
Also read: USD/MXN climbs amid soft Mexican GDP, mixed US economic data
Not only Wednesday’s Doji and downbeat oscialltors, namely the MACD and the RSI line, but the quote’s sustained trading below the convergence of the 21-DMA and 50-DMA, around the 17.00 round figure by the press time, also favors the USD/MXN bears.
As a result, a horizontal area around 16.70, comprising multiple lows marked since the mid-July, lures the Mexican Peso (MXN) buyers.
Following that, the multi-month low marked in July near 16.62 and the bottom line of a four-month-old bearish channel, close to 16.40 by the press time, will be in the spotlight.
On the contrary, a daily closing beyond the aforementioned DMA confluence surrounding the 17.00 threshold becomes necessary for the USD/MXN bull’s return.
Even so, the bearish channel’s top line can challenge the Mexican Peso (MXN) sellers around 17.15 before giving them control.
Trend: Bearish
Technical Levels: Supports and Resistances
USDMXN currently trading at 16.7979 at the time of writing. Pair opened at 16.795 and is trading with a change of 0.02 % .
| Overview | Overview.1 | |
|---|---|---|
| 0 | Today last price | 16.7979 |
| 1 | Today Daily Change | 0.0029 |
| 2 | Today Daily Change % | 0.0200 |
| 3 | Today daily open | 16.7950 |
The pair remains strongly bearish on the daily time frame. It trades below the 20 SMA @ 17.0106, 50 SMA 16.9841, 100 SMA @ 17.3371 and 200 SMA @ 18.1007.
| Trends | Trends.1 | |
|---|---|---|
| 0 | Daily SMA20 | 17.0106 |
| 1 | Daily SMA50 | 16.9841 |
| 2 | Daily SMA100 | 17.3371 |
| 3 | Daily SMA200 | 18.1007 |
The previous day high was 16.8888 while the previous day low was 16.7552. The daily 38.2% Fib levels comes at 16.8378, expected to provide resistance. Similarly, the daily 61.8% fib level is at 16.8062, expected to provide resistance.
Note the levels of interest below:
- Pivot support is noted at 16.7371, 16.6793, 16.6035
- Pivot resistance is noted at 16.8708, 16.9466, 17.0045
| Levels | Levels.1 |
|---|---|
| Previous Daily High | 16.8888 |
| Previous Daily Low | 16.7552 |
| Previous Weekly High | 17.0800 |
| Previous Weekly Low | 16.7366 |
| Previous Monthly High | 17.3957 |
| Previous Monthly Low | 16.6258 |
| Daily Fibonacci 38.2% | 16.8378 |
| Daily Fibonacci 61.8% | 16.8062 |
| Daily Pivot Point S1 | 16.7371 |
| Daily Pivot Point S2 | 16.6793 |
| Daily Pivot Point S3 | 16.6035 |
| Daily Pivot Point R1 | 16.8708 |
| Daily Pivot Point R2 | 16.9466 |
| Daily Pivot Point R3 | 17.0045 |
[/s2If]
Download Nehcap EAWe have two EAs that are operational on our LIVE accounts.
- EA-FIX: Check out the details here. Download EA-FIX . EA-FIX is a non-grid HFT scalper.
- EA-GROWTH: High quality low dd EA using trend grids. Download EA_GROWTHJoin Our Telegram Group
")


