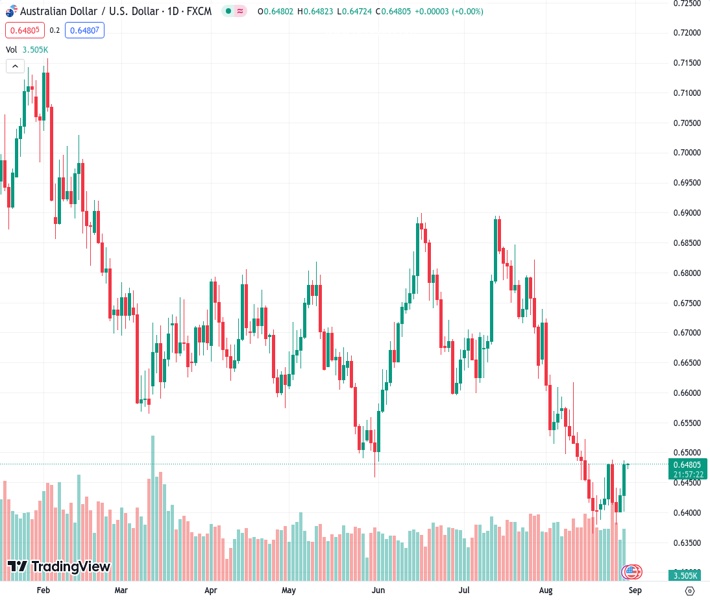
The Australian dollar against the US dollar is slightly increasing to 0.64800, following a significant rise, the largest seen in a week.
…
This is a premium post.
[s2If !current_user_can(access_s2member_level4)]Please register for FREE REGISTER to read full post below containing analysis. In case of any error or you think you are not able to read the full post below, please email us at support#nehcap.com [lwa][/s2If] [s2If current_user_can(access_s2member_level1)]
- AUD/USD edges higher after rising the most in a week.
The pair currently trades last at 0.64800.
The previous day high was 0.644 while the previous day low was 0.6402. The daily 38.2% Fib levels comes at 0.6425, expected to provide support. Similarly, the daily 61.8% fib level is at 0.6416, expected to provide support.
AUD/USD seesaws at the weekly high around 0.6480 after posting the stellar run-up on downbeat US data. It’s worth noting that the hawkish comments from Reserve Bank of Australia (RBA) Governor-Designate Michelle Bullock also favor the Aussie pair buyers as markets brace for the key Australia inflation data on early Wednesday.
On Tuesday, the Reserve Bank of Australia (RBA) Governor-Designate Michelle Bullock crossed wires while speaking at the Sir Leslie Melville Lecture at the Australian National University, in Canberra. In doing so, the policymaker initially conveyed too high inflation as her priority as Governor before flagging hopes of raising rates again. However, RBA’s Bullock also showed readings to watch data carefully for further decision-making.
On the other hand, the US Conference Board’s (CB) Consumer Confidence Index slumped to 106.10 for August from a downwardly revised 114.00 prior (from 117.0), versus 116.0 market forecasts. That said, the US JOLTS Job Openings slumped to the lowest since March 2021, to 8.827M for July versus 9.465M expected and 9.165M prior (revised from 9.582). Additionally, the US Housing Price Index eased to 0.3% MoM for June from 0.7% prior and 0.2% while the S&P/Case-Shiller Home Price Indices improved to -1.2% YoY from -1.7% previous readings and -1.3% market forecasts.
With the mostly downbeat US data, fears of the Fed’s September policy pivot escalate as the CME’s FedWatch Tool signals 16% chance of a rate hike versus 20% prior. The same propelled Wall Street and weighed on the US Treasury bond yields, as well as the US Dollar.
It’s worth noting, however, that a lack of impressive updates from the US-China talks in Beijing and fears of the International Monetary Fund’s (IMF) pause to the easy-lending prod the AUD/USD bulls, apart from the pre-data anxiety.
Moving on, Aussie housing numbers may entertain the pair traders but major attention will be given to the Australia Monthly Consumer Price Index (CPI) for July, expected to ease to 5.2% from 5.4% prior. Should the numbers ease, the AUD/USD may have a reason to pare the latest gains. It should be noted that strong prints of Aussie inflation don’t mean the pair’s permanent rally as the US ADP Employment Change, the final readings of the US second quarter (Q2) Gross Domestic Product (GDP) and the Personal Consumption Expenditure (PCE) are on the calendar. Should these early signals of the US employment and inflation rally, the US Dollar may pare the latest losses.
Also read: Australian Inflation Preview: Surprises in Monthly Consumer Price Index to rock the Aussie
A daily closing beyond six-week-old falling resistance line, around 0.6430 by the press time, keeps the AUD/USD pair buyers hopeful.
Technical Levels: Supports and Resistances
AUDUSD currently trading at 0.648 at the time of writing. Pair opened at 0.6429 and is trading with a change of 0.79% % .
| Overview | Overview.1 | |
|---|---|---|
| 0 | Today last price | 0.648 |
| 1 | Today Daily Change | 0.0051 |
| 2 | Today Daily Change % | 0.79% |
| 3 | Today daily open | 0.6429 |
The pair remains strongly bearish on the daily time frame. It trades below the 20 SMA @ 0.6484, 50 SMA 0.6628, 100 SMA @ 0.6652 and 200 SMA @ 0.6726.
| Trends | Trends.1 | |
|---|---|---|
| 0 | Daily SMA20 | 0.6484 |
| 1 | Daily SMA50 | 0.6628 |
| 2 | Daily SMA100 | 0.6652 |
| 3 | Daily SMA200 | 0.6726 |
The previous day high was 0.644 while the previous day low was 0.6402. The daily 38.2% Fib levels comes at 0.6425, expected to provide support. Similarly, the daily 61.8% fib level is at 0.6416, expected to provide support.
Note the levels of interest below:
- Pivot support is noted at 0.6407, 0.6386, 0.6369
- Pivot resistance is noted at 0.6445, 0.6462, 0.6483
| Levels | Levels.1 |
|---|---|
| Previous Daily High | 0.6440 |
| Previous Daily Low | 0.6402 |
| Previous Weekly High | 0.6488 |
| Previous Weekly Low | 0.6380 |
| Previous Monthly High | 0.6895 |
| Previous Monthly Low | 0.6599 |
| Daily Fibonacci 38.2% | 0.6425 |
| Daily Fibonacci 61.8% | 0.6416 |
| Daily Pivot Point S1 | 0.6407 |
| Daily Pivot Point S2 | 0.6386 |
| Daily Pivot Point S3 | 0.6369 |
| Daily Pivot Point R1 | 0.6445 |
| Daily Pivot Point R2 | 0.6462 |
| Daily Pivot Point R3 | 0.6483 |
[/s2If]
Download Nehcap EAWe have two EAs that are operational on our LIVE accounts.
- EA-FIX: Check out the details here. Download EA-FIX . EA-FIX is a non-grid HFT scalper.
- EA-GROWTH: High quality low dd EA using trend grids. Download EA_GROWTHJoin Our Telegram Group
")


