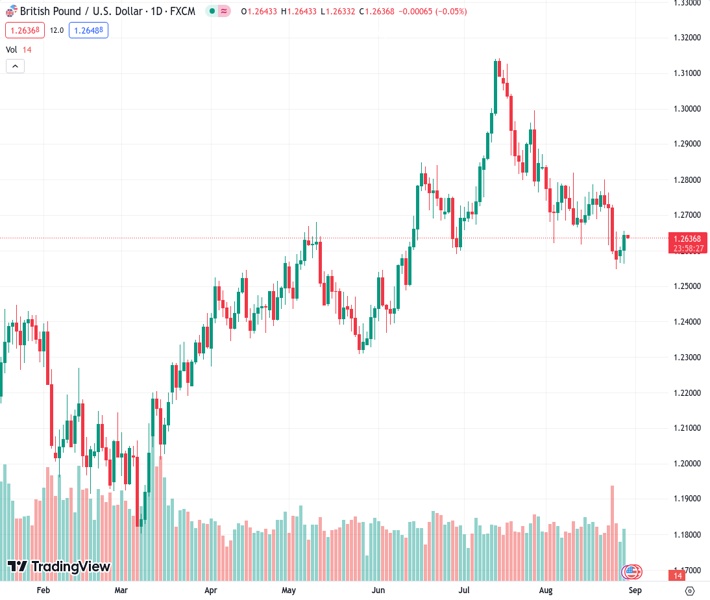
The GBPUSD currency pair, at a value of 1.26431, has exceeded the 1.2645 level and reclaimed the 100-day Simple Moving Average (SMA).
…
This is a premium post.
[s2If !current_user_can(access_s2member_level4)]Please register for FREE REGISTER to read full post below containing analysis. In case of any error or you think you are not able to read the full post below, please email us at support#nehcap.com [lwa][/s2If] [s2If current_user_can(access_s2member_level1)]
- GBP/USD rose above the 1.2645 area and reconquered the 100-day SMA.
The pair currently trades last at 1.26431.
The previous day high was 1.2611 while the previous day low was 1.2566. The daily 38.2% Fib levels comes at 1.2594, expected to provide support. Similarly, the daily 61.8% fib level is at 1.2583, expected to provide support.
In Tuesday’s session, the USD weakened against most of its rivals, driven by weaker-than-expected employment data, which fueled dovish bets on the Federal Reserve (Fed). In addition, the GBP also traded weak against most of its rivals following the release of food inflation figures from the UK in August.
The US Bureau of Labor Statistics reported that the JOLTs Job Openings figures from the United States missed the consensus in July. The actual figure came in at 8.82 million, lower than the expected 9.465 million from the previous reading of 9.16 million. As a reaction, the 2-year yield led to a decline in the US bond rates, falling by more than 3% to its lowest level in almost three weeks. That fall could be explained by markets now pricing in rate cuts by the Fed in June while markets placed bets on July in the previous sessions.
On the other hand, the British Retail Consortium reported a decrease in shop price inflation, which dropped to 6.9% YoY from 7.6% in July. That being said, hawkish expectations on the Bank of England (BoE) remain steady, and the World Interest Rates Probabilities (WIRP) tool suggests that markets are factoring in a 75% probability of a 25bps hike by the upcoming Sep 21, 2023 meeting from the Bank of England (BoE). Looking ahead, the likelihood of a similar hike stands at 80% in November, followed by a 90% chance of a 25bps hike in the December meeting, bringing the target rate to 6%. In that sense, tightening expectations may limit the GBP’s losses.
Considering the daily chart, GBP/USD presents a neutral to bullish outlook, with the bulls showing resilience and gaining momentum. The Relative Strength Index (RSI) holds a positive slope below its midline, while the Moving Average Convergence (MACD) histogram exhibits decreasing red bars. Furthermore, the pair is below the 20-day Simple Moving Average (SMA) but above the 100 and 200-day SMAs, indicating that the bulls still have the upper hand when looking at the broader picture.
Support levels: 1.2642 (100-day SMA), 1.2600, 1.2550.
Resistance levels: 1.2670, 1.2700 (20-day SMA), 1.2730.
Technical Levels: Supports and Resistances
GBPUSD currently trading at 1.2646 at the time of writing. Pair opened at 1.2602 and is trading with a change of 0.35 % .
| Overview | Overview.1 | |
|---|---|---|
| 0 | Today last price | 1.2646 |
| 1 | Today Daily Change | 0.0044 |
| 2 | Today Daily Change % | 0.3500 |
| 3 | Today daily open | 1.2602 |
The pair is trading below its 20 Daily moving average @ 1.2708, below its 50 Daily moving average @ 1.2784 , above its 100 Daily moving average @ 1.2642 and above its 200 Daily moving average @ 1.2403
| Trends | Trends.1 | |
|---|---|---|
| 0 | Daily SMA20 | 1.2708 |
| 1 | Daily SMA50 | 1.2784 |
| 2 | Daily SMA100 | 1.2642 |
| 3 | Daily SMA200 | 1.2403 |
The previous day high was 1.2611 while the previous day low was 1.2566. The daily 38.2% Fib levels comes at 1.2594, expected to provide support. Similarly, the daily 61.8% fib level is at 1.2583, expected to provide support.
Note the levels of interest below:
- Pivot support is noted at 1.2575, 1.2547, 1.2529
- Pivot resistance is noted at 1.262, 1.2638, 1.2665
| Levels | Levels.1 |
|---|---|
| Previous Daily High | 1.2611 |
| Previous Daily Low | 1.2566 |
| Previous Weekly High | 1.2800 |
| Previous Weekly Low | 1.2548 |
| Previous Monthly High | 1.3142 |
| Previous Monthly Low | 1.2659 |
| Daily Fibonacci 38.2% | 1.2594 |
| Daily Fibonacci 61.8% | 1.2583 |
| Daily Pivot Point S1 | 1.2575 |
| Daily Pivot Point S2 | 1.2547 |
| Daily Pivot Point S3 | 1.2529 |
| Daily Pivot Point R1 | 1.2620 |
| Daily Pivot Point R2 | 1.2638 |
| Daily Pivot Point R3 | 1.2665 |
[/s2If]
Download Nehcap EAWe have two EAs that are operational on our LIVE accounts.
- EA-FIX: Check out the details here. Download EA-FIX . EA-FIX is a non-grid HFT scalper.
- EA-GROWTH: High quality low dd EA using trend grids. Download EA_GROWTHJoin Our Telegram Group
")


