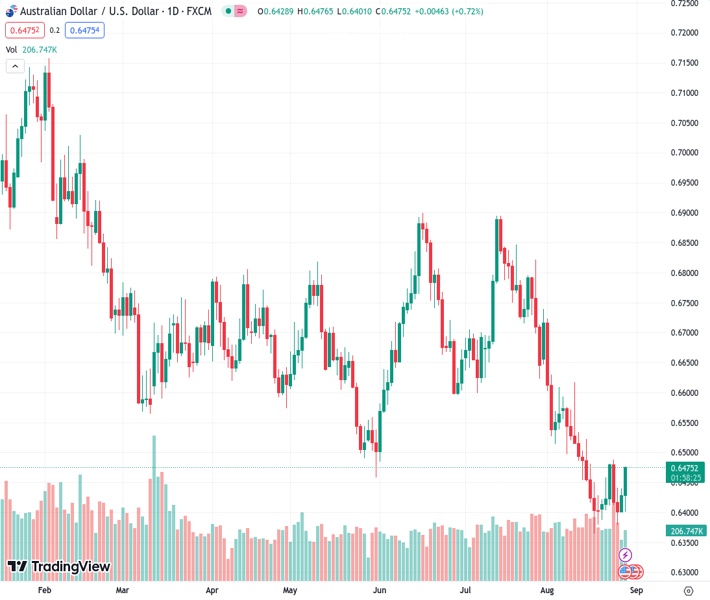
The AUDUSD pair reached a peak of 0.6465, the highest level in five days, and came close to breaking through the 20-day SMA of 0.6475.
…
This is a premium post.
[s2If !current_user_can(access_s2member_level4)]Please register for FREE REGISTER to read full post below containing analysis. In case of any error or you think you are not able to read the full post below, please email us at support#nehcap.com [lwa][/s2If] [s2If current_user_can(access_s2member_level1)]
- AUD/USD rose to a 5-day high towards 0.6465 and threatened the 20-day SMA of 0.6475.
The pair currently trades last at 0.64760.
The previous day high was 0.644 while the previous day low was 0.6402. The daily 38.2% Fib levels comes at 0.6425, expected to provide support. Similarly, the daily 61.8% fib level is at 0.6416, expected to provide support.
The AUD/USD soared by 0.60% to the 0.6465 level, mainly driven by a USD weakness fueled by poor labour market figures from the US and markets consequently betting on sooner rate cuts by the Federal Reserve (Fed). On the AUD’s side, investors await housing data from Australia from July to be released Wednesday and the monthly Consumer Price Index (CPI) from July.
The USD took a hit after the US Job Openings and Labor Turnover Survey (JOLTS) declined to 8.82 million, lower than the market’s expectations of 9.465 million. It is worth noticing that the labour market situation will highly determine the short-term USD trajectory as Federal Reserve officials and Jerome Powell stated that ongoing decisions will be decided “carefully”, pointing out that the labour market is still unbalanced. That said, markets could see volatility during this week when the US reports the ADP Employment Change from August on Wednesday and the Nonfarm Payrolls report from the same month.
The US Treasury yields for the 2, 5 and 10-year bond sharply decreased, reflecting dovish bets on the Federal Reserve. In line with that, World Interest Rates Probabilities (WIRP) show that markets are still betting on high chances of a 25 bps hike in November but have pushed back rate cuts by the Federal Reserve (Fed) from July to June.
Based on the daily chart, AUD/USD maintains a neutral to bullish technical perspective, indicating that the bulls are making strides in regaining control. The Relative Strength Index (RSI) shows an upward trend below its midline, suggesting a potential resurgence of bullish strength, while the Moving Average Convergence (MACD) histogram prints bigger green bars. Moreover, the pair is below the 20,100 and 200-day Simple Moving Averages (SMAs), suggesting that the buyers are struggling to overcome the overall bearish trend, and the bears are still in charge.
Support levels: 0.6430, 0.6400, 0.6380.
Resistance levels: 0.6475 (20-day SMA), 0.6500, 0.6525.
Technical Levels: Supports and Resistances
AUDUSD currently trading at 0.6469 at the time of writing. Pair opened at 0.6429 and is trading with a change of 0.62 % .
| Overview | Overview.1 | |
|---|---|---|
| 0 | Today last price | 0.6469 |
| 1 | Today Daily Change | 0.0040 |
| 2 | Today Daily Change % | 0.6200 |
| 3 | Today daily open | 0.6429 |
The pair remains strongly bearish on the daily time frame. It trades below the 20 SMA @ 0.6484, 50 SMA 0.6628, 100 SMA @ 0.6652 and 200 SMA @ 0.6726.
| Trends | Trends.1 | |
|---|---|---|
| 0 | Daily SMA20 | 0.6484 |
| 1 | Daily SMA50 | 0.6628 |
| 2 | Daily SMA100 | 0.6652 |
| 3 | Daily SMA200 | 0.6726 |
The previous day high was 0.644 while the previous day low was 0.6402. The daily 38.2% Fib levels comes at 0.6425, expected to provide support. Similarly, the daily 61.8% fib level is at 0.6416, expected to provide support.
Note the levels of interest below:
- Pivot support is noted at 0.6407, 0.6386, 0.6369
- Pivot resistance is noted at 0.6445, 0.6462, 0.6483
| Levels | Levels.1 |
|---|---|
| Previous Daily High | 0.6440 |
| Previous Daily Low | 0.6402 |
| Previous Weekly High | 0.6488 |
| Previous Weekly Low | 0.6380 |
| Previous Monthly High | 0.6895 |
| Previous Monthly Low | 0.6599 |
| Daily Fibonacci 38.2% | 0.6425 |
| Daily Fibonacci 61.8% | 0.6416 |
| Daily Pivot Point S1 | 0.6407 |
| Daily Pivot Point S2 | 0.6386 |
| Daily Pivot Point S3 | 0.6369 |
| Daily Pivot Point R1 | 0.6445 |
| Daily Pivot Point R2 | 0.6462 |
| Daily Pivot Point R3 | 0.6483 |
[/s2If]
Download Nehcap EAWe have two EAs that are operational on our LIVE accounts.
- EA-FIX: Check out the details here. Download EA-FIX . EA-FIX is a non-grid HFT scalper.
- EA-GROWTH: High quality low dd EA using trend grids. Download EA_GROWTHJoin Our Telegram Group
")


