#NZDUSD @ 0.59484 rallies to 0.5945, reversing from yearly lows, as US Job Openings fall short of expectations, reducing odds of a Fed rate hike in September.
…
This is a premium post.
[s2If !current_user_can(access_s2member_level4)]Please register for FREE REGISTER to read full post below containing analysis. In case of any error or you think you are not able to read the full post below, please email us at support#nehcap.com [lwa][/s2If] [s2If current_user_can(access_s2member_level1)]
- NZD/USD rallies to 0.5945, reversing from yearly lows, as US Job Openings fall short of expectations, reducing odds of a Fed rate hike in September.
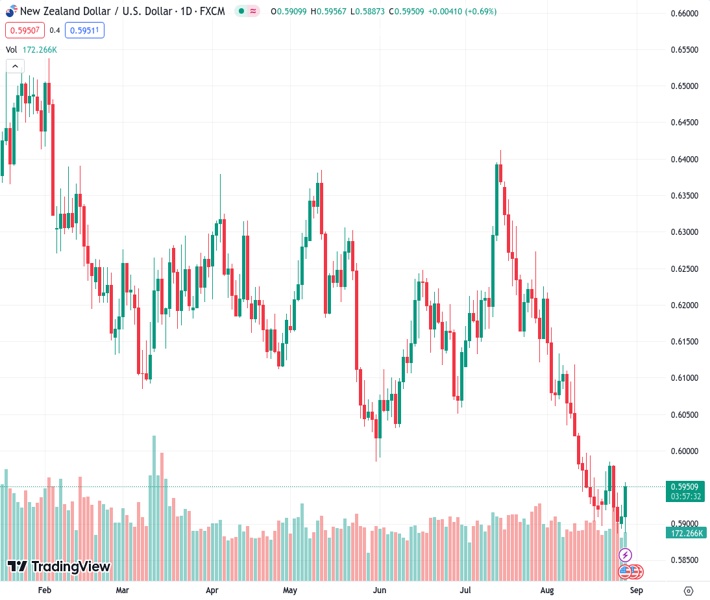
The pair currently trades last at 0.59484.
The previous day high was 0.5939 while the previous day low was 0.5894. The daily 38.2% Fib levels comes at 0.5922, expected to provide support. Similarly, the daily 61.8% fib level is at 0.5911, expected to provide support.
The New Zealand Dollar (NZD) rallied sharply against the US Dollar (USD) after weaker-than-expected labor market data, which could warrant the Fed to keep rates unchanged at the next meeting. Alongside Chinese authorities’ compromise to spur economic stimulus in the country bolstered the Antipodean. The NZD/USD is trading at 0.5945, at new three-day highs, after testing yearly lows of 0.5886.
Given the remarks of the Federal Reserve Chair Jerome Powell that a tight labor market and the economy growing above trend could warrant further tightening, today’s jobs report, and increased expectations, the Fed might refrain from lifting rates in September.
The US Bureau of Labor Statistics (BLS) revealed that Job Openings declined from 9.165 M in June to 8.827 M in July and beneath estimates of 9.465M. That said, traders’ focus shifts to Friday’s US Nonfarm Payrolls report, with estimates of 170K jobs added to the economy, below the prior month’s 187K, which would mark back-to-back reports with lower readings than estimates.
In other data, the Conference Board (CB) showed Consumer Confidence is decaying, as exhibited by August data coming at 106.1, below July’s 114, and forecasts of 116. Dana Peterson, the chief economist at the Conference Board, said, “Consumers were once again preoccupied with rising prices in general and for groceries and gasoline in particular.”
The report highlighted that inflation expectations for a year ahead jumped to 5.8%. The CB poll showed Americans are confident about finding a job, which shows the labor market is beginning to feel the pain of 525 basis points of tightening by the Fed.
Following the data, the NZD/USD extended its gains past the 0.5900 figure, extending towards its daily high of 0.5956. The Greenback dropped sharply below the 104.000 mark, down 0.30% at 103.664, as traders pared bets the Fed would continue to lift rates. Reflection of that is the CME FedWatch Tool showing for keeping rates at 5.25%-5.50%, at 86.5%, from 78% a day ago.
In the meantime, during the Asian session, China revealed its commitment to strengthen policy support, speed up government spending, and boost the weaker economic recovery achieved so far during the year.
The pair remains downward biased, although it’s printing a leg-up from YTD lows. For buyers to resume their uptrend, they must reclaim the last higher-high at 0.5985, which could pave the way for further NZD/USD upside. Failure to do so could exacerbate a continuation of the downtrend, eyeing the YTD low of 0.5886, followed by the November 10 low of 0.5840.
Technical Levels: Supports and Resistances
NZDUSD currently trading at 0.5944 at the time of writing. Pair opened at 0.591 and is trading with a change of 0.58 % .
| Overview | Overview.1 | |
|---|---|---|
| 0 | Today last price | 0.5944 |
| 1 | Today Daily Change | 0.0034 |
| 2 | Today Daily Change % | 0.5800 |
| 3 | Today daily open | 0.5910 |
The pair remains strongly bearish on the daily time frame. It trades below the 20 SMA @ 0.5996, 50 SMA 0.6119, 100 SMA @ 0.6149 and 200 SMA @ 0.6226.
| Trends | Trends.1 | |
|---|---|---|
| 0 | Daily SMA20 | 0.5996 |
| 1 | Daily SMA50 | 0.6119 |
| 2 | Daily SMA100 | 0.6149 |
| 3 | Daily SMA200 | 0.6226 |
The previous day high was 0.5939 while the previous day low was 0.5894. The daily 38.2% Fib levels comes at 0.5922, expected to provide support. Similarly, the daily 61.8% fib level is at 0.5911, expected to provide support.
Note the levels of interest below:
- Pivot support is noted at 0.589, 0.5869, 0.5844
- Pivot resistance is noted at 0.5935, 0.596, 0.598
| Levels | Levels.1 |
|---|---|
| Previous Daily High | 0.5939 |
| Previous Daily Low | 0.5894 |
| Previous Weekly High | 0.5987 |
| Previous Weekly Low | 0.5885 |
| Previous Monthly High | 0.6413 |
| Previous Monthly Low | 0.6120 |
| Daily Fibonacci 38.2% | 0.5922 |
| Daily Fibonacci 61.8% | 0.5911 |
| Daily Pivot Point S1 | 0.5890 |
| Daily Pivot Point S2 | 0.5869 |
| Daily Pivot Point S3 | 0.5844 |
| Daily Pivot Point R1 | 0.5935 |
| Daily Pivot Point R2 | 0.5960 |
| Daily Pivot Point R3 | 0.5980 |
[/s2If]
Download Nehcap EAWe have two EAs that are operational on our LIVE accounts.
- EA-FIX: Check out the details here. Download EA-FIX . EA-FIX is a non-grid HFT scalper.
- EA-GROWTH: High quality low dd EA using trend grids. Download EA_GROWTHJoin Our Telegram Group
")


