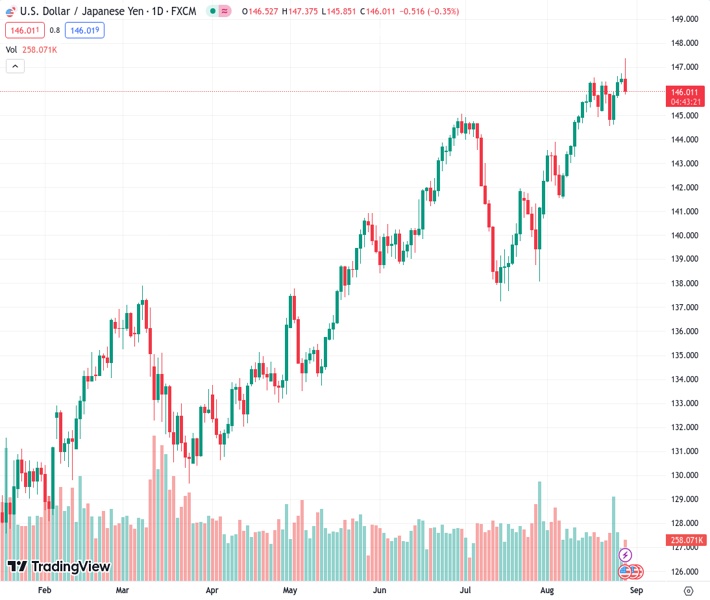
The USDJPY currency pair reached a peak of 147.35, its highest level in the current cycle, during the Asian session.
…
This is a premium post.
[s2If !current_user_can(access_s2member_level4)]Please register for FREE REGISTER to read full post below containing analysis. In case of any error or you think you are not able to read the full post below, please email us at support#nehcap.com [lwa][/s2If] [s2If current_user_can(access_s2member_level1)]
- USD/JPY spiked to a cycle high of 147.35 during the Asian session.
The pair currently trades last at 146.011.
The previous day high was 146.75 while the previous day low was 146.27. The daily 38.2% Fib levels comes at 146.57, expected to provide resistance. Similarly, the daily 61.8% fib level is at 146.45, expected to provide resistance.
On Tuesday, the USD/JPY reversed its course after rallying to a cycle high of 147.35 and settled below 146.00 at 145.95. On the US side, weak labour markets were reported, but on the positive side, optimistic Housing data was released. On the other hand, Japan reported weak labour market figures, which reminded investors about the Bank of Japan’s (BoJ) dovish stance.
The JOLTs Job Openings from the United States came in lower than expected in July. The figure came in at 8.82 million, while the markets expected a reading of 9.465 million and decelerated from the last revised reading of 9.165 million. Additionally, S&P/Case-Shiller Home Prices increased by 0.3% vs 0.2% but still came in below the previous figure of 0.7%. As a reaction, the USD measured by the DXY index retreated towards 103.90, accompanied by a sharp decline in US bond yields. Focus now shifts to ADP Employment Change and Nonfarm Payrolls from August for investors to model their expectations regarding the next Federal Reserve Decisions.
On the Japanese side, the unemployment rate rose to 2.7% in July, beating the expected 2.5%, while the job-to-applicant ratio fell to 1.29, lower than the expected 1.30, and suggests that the labour market is weakening. It is worth noting that the BoJ has made it clear that until local wage and inflation metrics are aligned, any monetary policy pivots will be withheld. In that sense, weak figures from the Japanese economy support the ultra-dovish stance of the BoJ, leaving the JPY vulnerable against most of its rivals.
The daily chart analysis shows that the short-term outlook for USD/JPY appears bullish. Both the Relative Strength Index (RSI) and Moving Average Convergence Divergence (MACD) maintain favourable positions, with the RSI above its midline and displaying an upward trend. Additionally, MACD exhibits green bars, indicating a strengthening bullish momentum. Moreover, the pair is above the 20,100,200-day Simple Moving Average (SMA), suggesting that the bulls are firmly in control of the bigger picture.
Support levels: 145.70, 145.50, 145.00.
Resistance levels: 147.00, 147.35, 147.50.
Technical Levels: Supports and Resistances
USDJPY currently trading at 146.01 at the time of writing. Pair opened at 146.54 and is trading with a change of -0.36 % .
| Overview | Overview.1 | |
|---|---|---|
| 0 | Today last price | 146.01 |
| 1 | Today Daily Change | -0.53 |
| 2 | Today Daily Change % | -0.36 |
| 3 | Today daily open | 146.54 |
The pair remains strongly bullish on the daily timeframe. It trades above its 20 SMA @ 144.74, 50 SMA 142.96, 100 SMA @ 140.01 and 200 SMA @ 136.7.
| Trends | Trends.1 | |
|---|---|---|
| 0 | Daily SMA20 | 144.74 |
| 1 | Daily SMA50 | 142.96 |
| 2 | Daily SMA100 | 140.01 |
| 3 | Daily SMA200 | 136.70 |
The previous day high was 146.75 while the previous day low was 146.27. The daily 38.2% Fib levels comes at 146.57, expected to provide resistance. Similarly, the daily 61.8% fib level is at 146.45, expected to provide resistance.
Note the levels of interest below:
- Pivot support is noted at 146.29, 146.05, 145.82
- Pivot resistance is noted at 146.76, 146.99, 147.24
| Levels | Levels.1 |
|---|---|
| Previous Daily High | 146.75 |
| Previous Daily Low | 146.27 |
| Previous Weekly High | 146.64 |
| Previous Weekly Low | 144.54 |
| Previous Monthly High | 144.91 |
| Previous Monthly Low | 137.24 |
| Daily Fibonacci 38.2% | 146.57 |
| Daily Fibonacci 61.8% | 146.45 |
| Daily Pivot Point S1 | 146.29 |
| Daily Pivot Point S2 | 146.05 |
| Daily Pivot Point S3 | 145.82 |
| Daily Pivot Point R1 | 146.76 |
| Daily Pivot Point R2 | 146.99 |
| Daily Pivot Point R3 | 147.24 |
[/s2If]
Download Nehcap EAWe have two EAs that are operational on our LIVE accounts.
- EA-FIX: Check out the details here. Download EA-FIX . EA-FIX is a non-grid HFT scalper.
- EA-GROWTH: High quality low dd EA using trend grids. Download EA_GROWTHJoin Our Telegram Group
")


