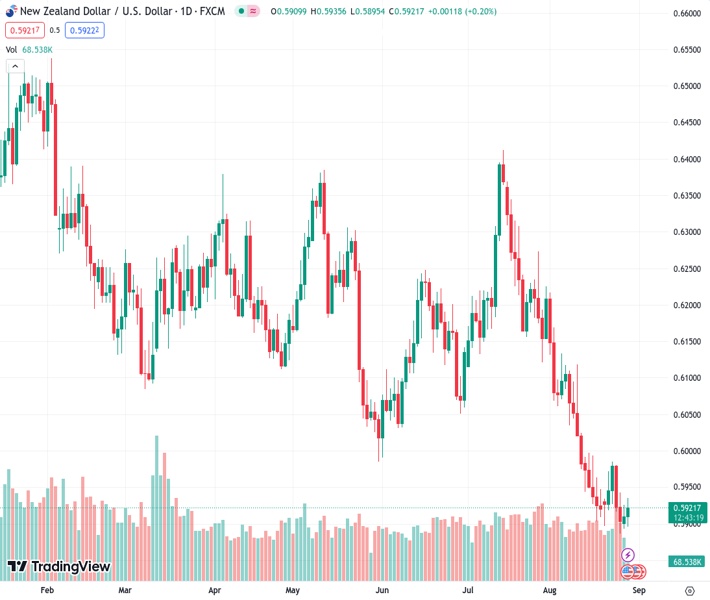
The currency pair NZD/USD, currently trading at 0.59204, continues to gain momentum in a positive direction for the second consecutive day. This upward movement is being driven by a weakening US dollar.
…
This is a premium post.
[s2If !current_user_can(access_s2member_level4)]Please register for FREE REGISTER to read full post below containing analysis. In case of any error or you think you are not able to read the full post below, please email us at support#nehcap.com [lwa][/s2If] [s2If current_user_can(access_s2member_level1)]
- NZD/USD gains positive traction for the second straight day and is supported by a softer USD.
The pair currently trades last at 0.59204.
The previous day high was 0.5939 while the previous day low was 0.5894. The daily 38.2% Fib levels comes at 0.5922, expected to provide resistance. Similarly, the daily 61.8% fib level is at 0.5911, expected to provide support.
The NZD/USD pair attracts some buyers for the second successive day on Tuesday and recovers further from its lowest level since November 2022, around the 0.5885 region touched last week. Spot prices stick to modest intraday gains through the early part of the European session and currently trade near the 0.5925 area, up over 0.20% for the day, though any meaningful upside still seems elusive.
The latest optimism led by new measures rolled out by China – to draw investors back into its battered stock markets – continues to drive some flows towards antipodean currencies, including the New Zealand Dollar (NZD). The US Dollar (USD), on the other hand, is pressured by a further decline in the US Treasury bond yields and retreats further from a nearly three-month top set last Friday. This turns out to be a key factors acting as a tailwind for the NZD/USD pair.
That said, rising bets for one more 25 bps rate hike by the Federal Reserve (Fed) in 2023 should help limit the downside for the US bond yields and the Greenback. It is worth recalling that Fed Chair Jerome Powell reiterated the message last week and said at the Jackson Hole Symposium that the US central bank may need to raise rates further to cool still-too-high inflation. Moreover, a resilient US economy should allow the Fed to stick to its hawkish stance for longer.
The aforementioned fundamental backdrop favours the USD bulls, which, along with concerns about the worsening economic conditions in China, warrants some caution before positioning for any further appreciating move for the NZD/USD pair. Traders might also prefer to move to the sidelines ahead of this week’s important macro release from the US and China, which will play a key role in determining the next leg of a directional move for spot prices.
A rather busy US economic docket kicks off with the release of the Conference Board’s Consumer Confidence Index and JOLTS Job Openings data on Tuesday. This will be followed by the revised estimate of the Q2 GDP growth on Wednesday, the PCE Price Index – the Fed’s preferred inflation gauge on Thursday and the closely watched jobs report (NFP) on Friday. Traders will further take cues from the official Chinese PMI prints on Thursday.
Hence, it will be prudent to wait for strong follow-through buying before confirming that the NZD/USD pair has bottomed out in the near term and placing aggressive bullish bets.
Technical Levels: Supports and Resistances
NZDUSD currently trading at 0.5921 at the time of writing. Pair opened at 0.591 and is trading with a change of 0.19 % .
| Overview | Overview.1 | |
|---|---|---|
| 0 | Today last price | 0.5921 |
| 1 | Today Daily Change | 0.0011 |
| 2 | Today Daily Change % | 0.1900 |
| 3 | Today daily open | 0.5910 |
The pair remains strongly bearish on the daily time frame. It trades below the 20 SMA @ 0.5996, 50 SMA 0.6119, 100 SMA @ 0.6149 and 200 SMA @ 0.6226.
| Trends | Trends.1 | |
|---|---|---|
| 0 | Daily SMA20 | 0.5996 |
| 1 | Daily SMA50 | 0.6119 |
| 2 | Daily SMA100 | 0.6149 |
| 3 | Daily SMA200 | 0.6226 |
The previous day high was 0.5939 while the previous day low was 0.5894. The daily 38.2% Fib levels comes at 0.5922, expected to provide resistance. Similarly, the daily 61.8% fib level is at 0.5911, expected to provide support.
Note the levels of interest below:
- Pivot support is noted at 0.589, 0.5869, 0.5844
- Pivot resistance is noted at 0.5935, 0.596, 0.598
| Levels | Levels.1 |
|---|---|
| Previous Daily High | 0.5939 |
| Previous Daily Low | 0.5894 |
| Previous Weekly High | 0.5987 |
| Previous Weekly Low | 0.5885 |
| Previous Monthly High | 0.6413 |
| Previous Monthly Low | 0.6120 |
| Daily Fibonacci 38.2% | 0.5922 |
| Daily Fibonacci 61.8% | 0.5911 |
| Daily Pivot Point S1 | 0.5890 |
| Daily Pivot Point S2 | 0.5869 |
| Daily Pivot Point S3 | 0.5844 |
| Daily Pivot Point R1 | 0.5935 |
| Daily Pivot Point R2 | 0.5960 |
| Daily Pivot Point R3 | 0.5980 |
[/s2If]
Download Nehcap EAWe have two EAs that are operational on our LIVE accounts.
- EA-FIX: Check out the details here. Download EA-FIX . EA-FIX is a non-grid HFT scalper.
- EA-GROWTH: High quality low dd EA using trend grids. Download EA_GROWTHJoin Our Telegram Group
")


