The USDJPY pair remains above the 50- and 100-hour Exponential Moving Averages (EMAs) and is showing a positive trend.
…
This is a premium post.
[s2If !current_user_can(access_s2member_level4)]Please register for FREE REGISTER to read full post below containing analysis. In case of any error or you think you are not able to read the full post below, please email us at support#nehcap.com [lwa][/s2If] [s2If current_user_can(access_s2member_level1)]
- USD/JPY holds above the 50- and 100-hour EMAs with an upward slope.
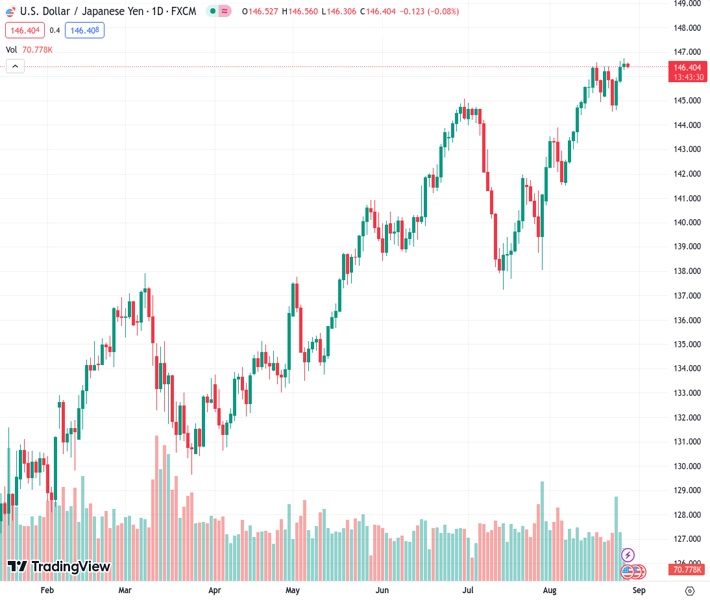
The pair currently trades last at 146.448.
The previous day high was 146.75 while the previous day low was 146.27. The daily 38.2% Fib levels comes at 146.57, expected to provide resistance. Similarly, the daily 61.8% fib level is at 146.45, expected to provide resistance.
The USD/JPY pair oscillates in a narrow range near 146.42 during the early European trading hours on Tuesday. Market participants prefer to wait on the sidelines ahead of the release of US CB Consumer Confidence and JOLTS Job Openings for July due later in the North American session.
Apart from this, the Japanese Unemployment Rate increased to 2.7% in July from 2.5% in June, according to the latest figures from the Statistics Bureau. The figure rose for the first time in four months and exerted pressure on the Bank of Japan (BoJ) and the government. However, traders turn cautious to place buying bets amid the fear of FX intervention by the BoJ.
Technically, the USD/JPY pair stands above the 50- and 100-hour Exponential Moving Averages (EMAs) with an upward slope, which means the path of least resistance is to the upside for the major pair.
The immediate resistance level for USD/JPY appears at a Year-To-Date (YTD) high of 146.75. Any meaningful follow-through buying will see a rally to the boundary of the Bollinger Band and a psychological round mark at the 146.90-147.00 region. Further north, the next barrier to watch for USD/JPY is located at 147.55 (a high of November 2022), followed by 148.00 (a round figure).
On the downside, the initial contention for the major pair is located at 145.80 (50-hour EMA). The next contention level emerges near a lower limit of the Bollinger Band at 145.55. Any intraday pullback below the latter would expose the next downside stop at 145.05 (100-hour EMA), and finally at 144.55 (a low of August 23).
It’s worth noting that the Relative Strength Index (RSI) stands in bullish territory above 50, which indicates that the upside momentum has been activated for the time being.
Technical Levels: Supports and Resistances
USDJPY currently trading at 146.41 at the time of writing. Pair opened at 146.54 and is trading with a change of -0.09 % .
| Overview | Overview.1 | |
|---|---|---|
| 0 | Today last price | 146.41 |
| 1 | Today Daily Change | -0.13 |
| 2 | Today Daily Change % | -0.09 |
| 3 | Today daily open | 146.54 |
The pair remains strongly bullish on the daily timeframe. It trades above its 20 SMA @ 144.74, 50 SMA 142.96, 100 SMA @ 140.01 and 200 SMA @ 136.7.
| Trends | Trends.1 | |
|---|---|---|
| 0 | Daily SMA20 | 144.74 |
| 1 | Daily SMA50 | 142.96 |
| 2 | Daily SMA100 | 140.01 |
| 3 | Daily SMA200 | 136.70 |
The previous day high was 146.75 while the previous day low was 146.27. The daily 38.2% Fib levels comes at 146.57, expected to provide resistance. Similarly, the daily 61.8% fib level is at 146.45, expected to provide resistance.
Note the levels of interest below:
- Pivot support is noted at 146.29, 146.05, 145.82
- Pivot resistance is noted at 146.76, 146.99, 147.24
| Levels | Levels.1 |
|---|---|
| Previous Daily High | 146.75 |
| Previous Daily Low | 146.27 |
| Previous Weekly High | 146.64 |
| Previous Weekly Low | 144.54 |
| Previous Monthly High | 144.91 |
| Previous Monthly Low | 137.24 |
| Daily Fibonacci 38.2% | 146.57 |
| Daily Fibonacci 61.8% | 146.45 |
| Daily Pivot Point S1 | 146.29 |
| Daily Pivot Point S2 | 146.05 |
| Daily Pivot Point S3 | 145.82 |
| Daily Pivot Point R1 | 146.76 |
| Daily Pivot Point R2 | 146.99 |
| Daily Pivot Point R3 | 147.24 |
[/s2If]
Download Nehcap EAWe have two EAs that are operational on our LIVE accounts.
- EA-FIX: Check out the details here. Download EA-FIX . EA-FIX is a non-grid HFT scalper.
- EA-GROWTH: High quality low dd EA using trend grids. Download EA_GROWTHJoin Our Telegram Group
")


