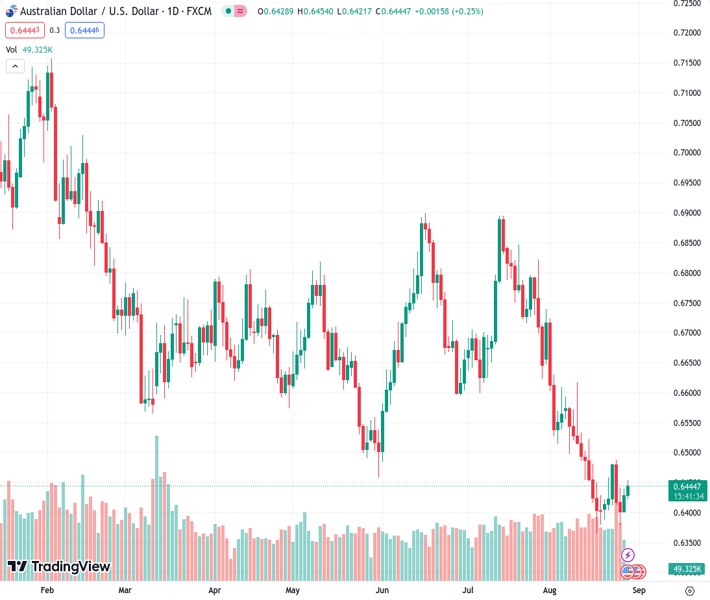
The AUDUSD pair, currently at 0.64452, reduces its gains during the day, breaking the pattern of a symmetrical triangle that has lasted for two weeks.
…
This is a premium post.
[s2If !current_user_can(access_s2member_level4)]Please register for FREE REGISTER to read full post below containing analysis. In case of any error or you think you are not able to read the full post below, please email us at support#nehcap.com [lwa][/s2If] [s2If current_user_can(access_s2member_level1)]
- AUD/USD pares intraday gains within two-week-old symmetrical triangle.
The pair currently trades last at 0.64452.
The previous day high was 0.644 while the previous day low was 0.6402. The daily 38.2% Fib levels comes at 0.6425, expected to provide support. Similarly, the daily 61.8% fib level is at 0.6416, expected to provide support.
AUD/USD retreats from intraday high to 0.6445 as markets brace for key Aussie catalysts heading into Tuesday’s European session. Even so, the risk-barometer pair remains firmer for the second consecutive day while staying inside a fortnight-old symmetrical triangle.
That said, Reserve Bank of Australia (RBA) Deputy Governor Michele Bullock, to be the Governor in three weeks, is up for a speech and will be closely observed as the pair buyers run out of steam due to fears of policy pivot. Following that, the US Conference Board’s (CB) Consumer Confidence Index for August, expected at 116.2 versus prior 117.00, will direct the AUD/USD pair’s moves.
Technically, the Aussie pair remains on the front foot despite the latest inaction as it defends the previous week’s upside break of a one-month-old resistance line, now support around 0.6360, with a symmetrical triangle. Adding strength to the upside bias is the firmer RSI (14) line, not overbought.
However, the 100-SMA and the stated triangle’s top line, respectively near 0.6465 and 0.6475, could restrict the pair’s immediate upside ahead of the 200-SMA hurdle of 0.6590.
In a case where the AUD/USD remains firmer past 0.6590, a downward-sloping resistance line from July 14, close to 0.6630 at the latest, will be in the spotlight.
On the contrary, a downside break of the stated triangle’s bottom line, close to the 0.6400 threshold as we write, isn’t an open invitation to the AUD/USD bears as a convergence of the previous resistance line and the yearly low, around 0.6360, appears a tough nut to crack for sellers.
Limited upside expected
Technical Levels: Supports and Resistances
AUDUSD currently trading at 0.6444 at the time of writing. Pair opened at 0.6429 and is trading with a change of 0.23% % .
| Overview | Overview.1 | |
|---|---|---|
| 0 | Today last price | 0.6444 |
| 1 | Today Daily Change | 0.0015 |
| 2 | Today Daily Change % | 0.23% |
| 3 | Today daily open | 0.6429 |
The pair remains strongly bearish on the daily time frame. It trades below the 20 SMA @ 0.6484, 50 SMA 0.6628, 100 SMA @ 0.6652 and 200 SMA @ 0.6726.
| Trends | Trends.1 | |
|---|---|---|
| 0 | Daily SMA20 | 0.6484 |
| 1 | Daily SMA50 | 0.6628 |
| 2 | Daily SMA100 | 0.6652 |
| 3 | Daily SMA200 | 0.6726 |
The previous day high was 0.644 while the previous day low was 0.6402. The daily 38.2% Fib levels comes at 0.6425, expected to provide support. Similarly, the daily 61.8% fib level is at 0.6416, expected to provide support.
Note the levels of interest below:
- Pivot support is noted at 0.6407, 0.6386, 0.6369
- Pivot resistance is noted at 0.6445, 0.6462, 0.6483
| Levels | Levels.1 |
|---|---|
| Previous Daily High | 0.6440 |
| Previous Daily Low | 0.6402 |
| Previous Weekly High | 0.6488 |
| Previous Weekly Low | 0.6380 |
| Previous Monthly High | 0.6895 |
| Previous Monthly Low | 0.6599 |
| Daily Fibonacci 38.2% | 0.6425 |
| Daily Fibonacci 61.8% | 0.6416 |
| Daily Pivot Point S1 | 0.6407 |
| Daily Pivot Point S2 | 0.6386 |
| Daily Pivot Point S3 | 0.6369 |
| Daily Pivot Point R1 | 0.6445 |
| Daily Pivot Point R2 | 0.6462 |
| Daily Pivot Point R3 | 0.6483 |
[/s2If]
Download Nehcap EAWe have two EAs that are operational on our LIVE accounts.
- EA-FIX: Check out the details here. Download EA-FIX . EA-FIX is a non-grid HFT scalper.
- EA-GROWTH: High quality low dd EA using trend grids. Download EA_GROWTHJoin Our Telegram Group
")


