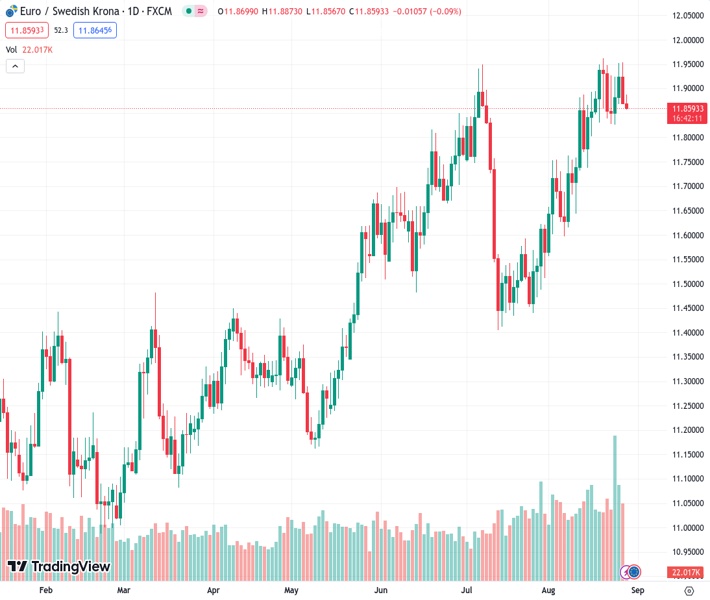
The trading pair EURSEK is currently at 11.8600 and is moving within a trend-channel that is going up according to the four-hour chart.
…
This is a premium post.
[s2If !current_user_can(access_s2member_level4)]Please register for FREE REGISTER to read full post below containing analysis. In case of any error or you think you are not able to read the full post below, please email us at support#nehcap.com [lwa][/s2If] [s2If current_user_can(access_s2member_level1)]
- EUR/SEK trades within the ascending trend-channel on the four-hour chart.
The pair currently trades last at 11.8600.
The previous day high was 11.9664 while the previous day low was 11.8747. The daily 38.2% Fib levels comes at 11.9098, expected to provide resistance. Similarly, the daily 61.8% fib level is at 11.9314, expected to provide resistance.
The EUR/SEK cross loses traction after retreating from a weekly high of 1.9455 during the Asian session on Tuesday. The cross currently trades near 11.8577, down 0.19% on the day.
From the technical perspective, EUR/SEK trades within the ascending trend-channel since the middle of July on the four-hour chart. Additionally, the cross holds above the key 100-hour Exponential Moving Average (EMA), which means the further upside looks favorable for the time being.
That said, the key support level for EUR/SEK is seen at 11.8550, representing the lower limit of the ascending trend-channel. A decisive break below the latter will see a drop to 11.8255 (a low of August 24). The next contention level will emerge at 11.8275 (100-hour EMA). The additional downside filter is located at 11.7375 (a low of August 15).
On the upside, the 50-hour EMA at 11.8752 acts as an immediate resistance level for the cross, en route to 11.9235 (a high of August 24). The next upside stop to watch is 11.9500 (a high of July 7). The key barrier for EUR/SEK is located at 11.9625, representing a Year-To-Date (YTD) high. Any meaningful follow-through buying above the latter will see a rally to the next critical area at 12.00. The mentioned level portrays a psychological round figure and the upper boundary of the ascending trend-channel.
It’s worth noting that the Relative Strength Index (RSI) stands in bearish territory below 50, indicating the path of least resistance seems lower for now.
Technical Levels: Supports and Resistances
EURSEK currently trading at 11.8609 at the time of writing. Pair opened at 11.8837 and is trading with a change of -0.19 % .
| Overview | Overview.1 | |
|---|---|---|
| 0 | Today last price | 11.8609 |
| 1 | Today Daily Change | -0.0228 |
| 2 | Today Daily Change % | -0.1900 |
| 3 | Today daily open | 11.8837 |
The pair remains strongly bullish on the daily timeframe. It trades above its 20 SMA @ 11.7984, 50 SMA 11.7207, 100 SMA @ 11.5789 and 200 SMA @ 11.3626.
| Trends | Trends.1 | |
|---|---|---|
| 0 | Daily SMA20 | 11.7984 |
| 1 | Daily SMA50 | 11.7207 |
| 2 | Daily SMA100 | 11.5789 |
| 3 | Daily SMA200 | 11.3626 |
The previous day high was 11.9664 while the previous day low was 11.8747. The daily 38.2% Fib levels comes at 11.9098, expected to provide resistance. Similarly, the daily 61.8% fib level is at 11.9314, expected to provide resistance.
Note the levels of interest below:
- Pivot support is noted at 11.8501, 11.8166, 11.7584
- Pivot resistance is noted at 11.9419, 12.0, 12.0336
| Levels | Levels.1 |
|---|---|
| Previous Daily High | 11.9664 |
| Previous Daily Low | 11.8747 |
| Previous Weekly High | 11.9646 |
| Previous Weekly Low | 11.7798 |
| Previous Monthly High | 11.9542 |
| Previous Monthly Low | 11.2825 |
| Daily Fibonacci 38.2% | 11.9098 |
| Daily Fibonacci 61.8% | 11.9314 |
| Daily Pivot Point S1 | 11.8501 |
| Daily Pivot Point S2 | 11.8166 |
| Daily Pivot Point S3 | 11.7584 |
| Daily Pivot Point R1 | 11.9419 |
| Daily Pivot Point R2 | 12.0000 |
| Daily Pivot Point R3 | 12.0336 |
[/s2If]
Download Nehcap EAWe have two EAs that are operational on our LIVE accounts.
- EA-FIX: Check out the details here. Download EA-FIX . EA-FIX is a non-grid HFT scalper.
- EA-GROWTH: High quality low dd EA using trend grids. Download EA_GROWTHJoin Our Telegram Group
")


