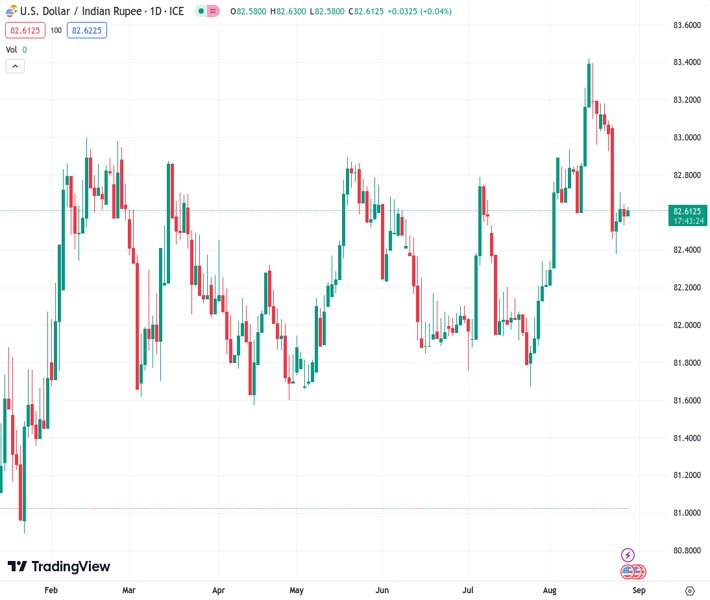
The USD/INR currency pair is stabilizing at a rate of 82.6175, as it prepares for the upcoming release of economic data from both countries.
…
This is a premium post.
[s2If !current_user_can(access_s2member_level4)]Please register for FREE REGISTER to read full post below containing analysis. In case of any error or you think you are not able to read the full post below, please email us at support#nehcap.com [lwa][/s2If] [s2If current_user_can(access_s2member_level1)]
- USD/INR consolidates ahead of the data releases from both nations.
The pair currently trades last at 82.6175.
The previous day high was 82.75 while the previous day low was 82.5165. The daily 38.2% Fib levels comes at 82.6608, expected to provide resistance. Similarly, the daily 61.8% fib level is at 82.6057, expected to provide support.
USD/INR trades sideways around 82.60 during the Asian session on Tuesday as market participants prepare for forthcoming data releases from India and the United States (US). Furthermore, the positive sentiment stemming in the Asian regional markets from China’s economic stimulus actions is favoring the Indian Rupee (INR) buyers.
Beijing implemented a reduction of 0.1% in the stamp duty on stock trading. Additionally, traders are closely monitoring the visit of US Commerce Secretary Gina Raimondo to China, with the aim of strengthening trade relations between the United States and China. The stability in China’s economy could contribute to support for the Indian Rupee (INR) buyers.
Investors await upcoming data releases from the US, seeking fresh impetus on the US economic outlook. These datasets include Jolts Job Openings, Housing Price Index, and Consumer Confidence scheduled to be unveiled later in the day.
During the week, US Core Personal Consumption Expenditures (PCE) Index, weekly Jobless Claims, and Nonfarm Payrolls will be in focus. Likewise, India’s Gross Domestic Product (GDP) is expected to improve in the second quarter report, which is due to be released on Thursday.
Additionally, an inquiry conducted by India’s market regulator into the Adani group has revealed instances of breaches in regulations concerning disclosures by listed entities and limits on offshore fund holdings. The Securities and Exchange Board of India (SEBI) initiated the investigation following concerns raised by US-based Hindenburg Research regarding governance issues surrounding the Adani group. The situation could potentially exert pressure on Indian equities, possibly leading to support for the USD/INR pair.
The US Dollar Index (DXY), gauging the Greenback’s performance against six other major currencies, trades lower around 103.80. The decline in the US Treasury yield is undermining the US Dollar (USD) due to a prevailing sense of caution, following the support for the hawkish stance by the US Federal Reserve Chair Jerome Powell.
Technical Levels: Supports and Resistances
USDINR currently trading at 82.6195 at the time of writing. Pair opened at 82.75 and is trading with a change of -0.16 % .
| Overview | Overview.1 | |
|---|---|---|
| 0 | Today last price | 82.6195 |
| 1 | Today Daily Change | -0.1305 |
| 2 | Today Daily Change % | -0.1600 |
| 3 | Today daily open | 82.7500 |
The pair is trading below its 20 Daily moving average @ 82.8912, above its 50 Daily moving average @ 82.4394 , above its 100 Daily moving average @ 82.3226 and above its 200 Daily moving average @ 82.2669
| Trends | Trends.1 | |
|---|---|---|
| 0 | Daily SMA20 | 82.8912 |
| 1 | Daily SMA50 | 82.4394 |
| 2 | Daily SMA100 | 82.3226 |
| 3 | Daily SMA200 | 82.2669 |
The previous day high was 82.75 while the previous day low was 82.5165. The daily 38.2% Fib levels comes at 82.6608, expected to provide resistance. Similarly, the daily 61.8% fib level is at 82.6057, expected to provide support.
Note the levels of interest below:
- Pivot support is noted at 82.5943, 82.4386, 82.3608
- Pivot resistance is noted at 82.8279, 82.9058, 83.0614
| Levels | Levels.1 |
|---|---|
| Previous Daily High | 82.7500 |
| Previous Daily Low | 82.5165 |
| Previous Weekly High | 83.2100 |
| Previous Weekly Low | 82.3485 |
| Previous Monthly High | 82.8334 |
| Previous Monthly Low | 81.6588 |
| Daily Fibonacci 38.2% | 82.6608 |
| Daily Fibonacci 61.8% | 82.6057 |
| Daily Pivot Point S1 | 82.5943 |
| Daily Pivot Point S2 | 82.4386 |
| Daily Pivot Point S3 | 82.3608 |
| Daily Pivot Point R1 | 82.8279 |
| Daily Pivot Point R2 | 82.9058 |
| Daily Pivot Point R3 | 83.0614 |
[/s2If]
Download Nehcap EAWe have two EAs that are operational on our LIVE accounts.
- EA-FIX: Check out the details here. Download EA-FIX . EA-FIX is a non-grid HFT scalper.
- EA-GROWTH: High quality low dd EA using trend grids. Download EA_GROWTHJoin Our Telegram Group
")


