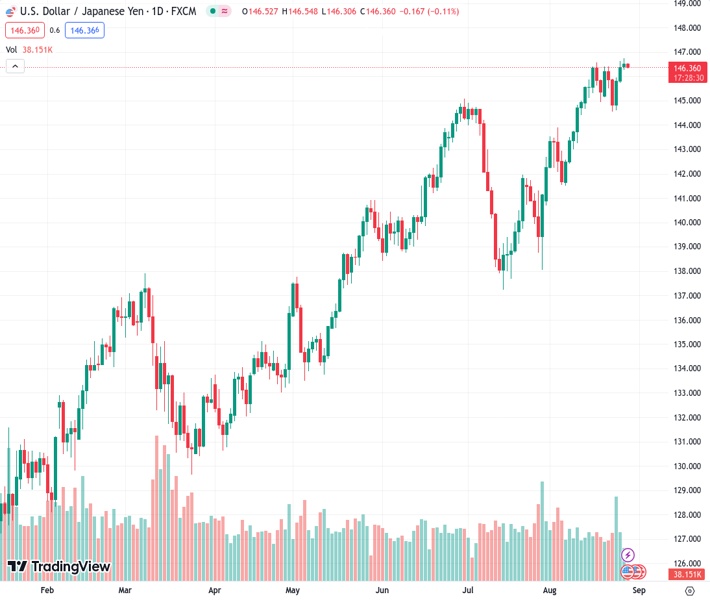
Despite not showing recent downward momentum, the USDJPY pair at 146.362 has experienced its first daily decline in four days.
…
This is a premium post.
[s2If !current_user_can(access_s2member_level4)]Please register for FREE REGISTER to read full post below containing analysis. In case of any error or you think you are not able to read the full post below, please email us at support#nehcap.com [lwa][/s2If] [s2If current_user_can(access_s2member_level1)]
- USD/JPY prints the first daily loss in four despite lacking downside momentum of late.
The pair currently trades last at 146.362.
The previous day high was 146.75 while the previous day low was 146.27. The daily 38.2% Fib levels comes at 146.57, expected to provide resistance. Similarly, the daily 61.8% fib level is at 146.45, expected to provide resistance.
USD/JPY bears flex muscles around 146.40 while printing the first intraday loss, down 0.10% on a day, heading into Tuesday’s European session. In doing so, the Yen pair justifies the recent shift in the bias toward the Bank of Japan (BoJ), as well as the inflation conditions of Japan. However, downbeat concerns about Japan’s employment situations and the cautious mood ahead of the top-tier data/events prod the Yen pair sellers.
That said, Japan’s Unemployment Rate offered a surprise increase to 2.7% for July versus 2.5% expected and prior while the Jobs / Applicants Ratio eased to 1.29 for the said month versus 1.30 anticipated and previous readings.
More importantly, the Japanese government recently released its annual report suggesting the inflection point for the inflation conditions in Japan after 25 years of efforts to overcome the deflation. As a result, the hawkish bias about the BoJ gains momentum.
On Monday, the mixed details of Japan’s Coincident Index for June and the Leading Economic Index for the said month also prod the USD/JPY pair traders. It’s worth noting that BoJ Governor Kazuo Ueda cited a bit below target Japan inflation to defend the currently ultra-easy monetary policy at the Jackson Hole Symposium, which in turn prods the pair sellers.
Elsewhere, downbeat yields join the broad US Dollar weakness ahead of today’s US CB Consumer Confidence for August to weigh on the USD/JPY price.
US 10-year Treasury bond yields remain pressured around 4.19% while the US Dollar Index (DXY) also drops to 103.85 by the press time. It’s worth noting that the US two-year bond coupons reversed from the highest level since 2007 the previous day and remained depressed near 5.00% by the press time.
On the contrary, Goldman Sachs highlights the US growth outlook and BoJ’s defense of easy-money policy to forecast a 30-year high of around 155.00, versus 135.00 previous prediction, for the USD/JPY pair.
Looking ahead, concerns about the monetary policies of the Federal Reserve (Fed) and the BoJ will join the risk catalysts to entertain the USD/JPY traders before the US Conference Board’s (CB) Consumer Confidence Index for August, expected at 116.2 versus prior 117.00.
The nearly overbought RSI (14) line joins the failure to cross a two-month-old ascending resistance line, close to 146.80 at the latest, to suggest a pullback in the USD/JPY price towards the 144.60-50 support zone comprising multiple levels marked since April.
Technical Levels: Supports and Resistances
USDJPY currently trading at 146.38 at the time of writing. Pair opened at 146.54 and is trading with a change of -0.11% % .
| Overview | Overview.1 | |
|---|---|---|
| 0 | Today last price | 146.38 |
| 1 | Today Daily Change | -0.16 |
| 2 | Today Daily Change % | -0.11% |
| 3 | Today daily open | 146.54 |
The pair remains strongly bullish on the daily timeframe. It trades above its 20 SMA @ 144.74, 50 SMA 142.96, 100 SMA @ 140.01 and 200 SMA @ 136.7.
| Trends | Trends.1 | |
|---|---|---|
| 0 | Daily SMA20 | 144.74 |
| 1 | Daily SMA50 | 142.96 |
| 2 | Daily SMA100 | 140.01 |
| 3 | Daily SMA200 | 136.70 |
The previous day high was 146.75 while the previous day low was 146.27. The daily 38.2% Fib levels comes at 146.57, expected to provide resistance. Similarly, the daily 61.8% fib level is at 146.45, expected to provide resistance.
Note the levels of interest below:
- Pivot support is noted at 146.29, 146.05, 145.82
- Pivot resistance is noted at 146.76, 146.99, 147.24
| Levels | Levels.1 |
|---|---|
| Previous Daily High | 146.75 |
| Previous Daily Low | 146.27 |
| Previous Weekly High | 146.64 |
| Previous Weekly Low | 144.54 |
| Previous Monthly High | 144.91 |
| Previous Monthly Low | 137.24 |
| Daily Fibonacci 38.2% | 146.57 |
| Daily Fibonacci 61.8% | 146.45 |
| Daily Pivot Point S1 | 146.29 |
| Daily Pivot Point S2 | 146.05 |
| Daily Pivot Point S3 | 145.82 |
| Daily Pivot Point R1 | 146.76 |
| Daily Pivot Point R2 | 146.99 |
| Daily Pivot Point R3 | 147.24 |
[/s2If]
Download Nehcap EAWe have two EAs that are operational on our LIVE accounts.
- EA-FIX: Check out the details here. Download EA-FIX . EA-FIX is a non-grid HFT scalper.
- EA-GROWTH: High quality low dd EA using trend grids. Download EA_GROWTHJoin Our Telegram Group
")


