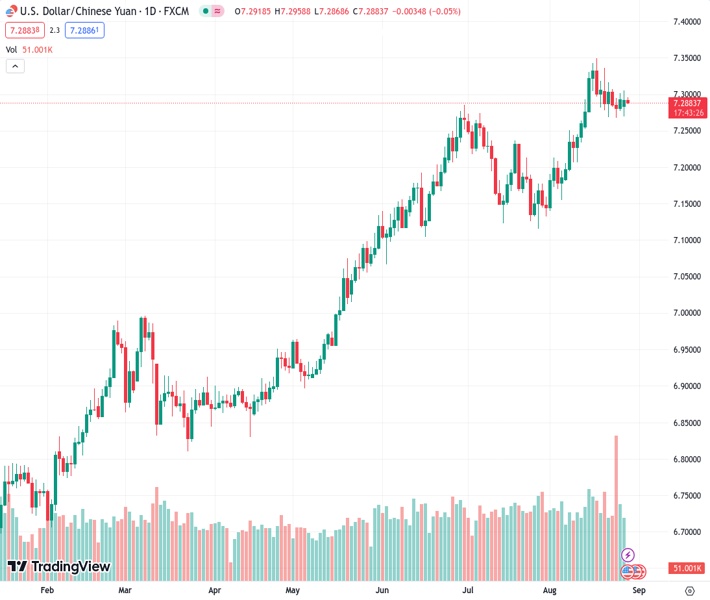
The USDCNH exchange rate at 7.28857 is showing no clear direction within the same day and is staying within a specific range on Tuesday.
…
This is a premium post.
[s2If !current_user_can(access_s2member_level4)]Please register for FREE REGISTER to read full post below containing analysis. In case of any error or you think you are not able to read the full post below, please email us at support#nehcap.com [lwa][/s2If] [s2If current_user_can(access_s2member_level1)]
- USD/CNH lacks any firm intraday direction and remains confined in a range on Tuesday.
The pair currently trades last at 7.28857.
The previous day high was 7.3056 while the previous day low was 7.2696. The daily 38.2% Fib levels comes at 7.2834, expected to provide support. Similarly, the daily 61.8% fib level is at 7.2919, expected to provide resistance.
The USD/CNH pair struggles to gain any meaningful traction on Tuesday and oscillates in a narrow band, around the 7.2900 mark through the Asian session.
The People’s Bank of China (PBoC) has been persistently setting stronger-than-expected daily-mid-points for the Chinese Yuan, which, along with a modest US Dollar (USD) weakness, act as a headwind for the USD/CNH pair. The downside, however, remains cushioned in the wake of growing worries about the worsening economic conditions in China. Apart from this, expectations that the Federal Reserve (Fed) will keep interest rates higher for longer favour the USD bulls and suggest that the path of least hurdle for spot prices is to the upside.
From a technical perspective, the USD/CNH pair has been showing some resilience below the 7.2700 round figure since early last week. Hence, acceptance below the said level might prompt some technical selling and pave the way for an extension of the recent pullback from the highest level since April 2022, around the 7.3500 touched earlier this month. Spot prices might then turn vulnerable to accelerate the downward trajectory towards testing the next relevant support near the 7.2300 area en route to the 7.2200-7.2180 region and the 7.2100.
On the flip side, bulls might now wait for a sustained strength beyond the 7.3000-7.3050 region before placing fresh bets, above which the USD/CNH pair could aim to challenge the 7.3355 supply zone. Some follow-through buying beyond the YTD peak will be seen as a fresh trigger for bullish traders and expose the 2022 swing high, around the 7.3750 region with some intermediate resistance near the 7.3600.
Technical Levels: Supports and Resistances
USDCNH currently trading at 7.2892 at the time of writing. Pair opened at 7.2932 and is trading with a change of -0.05 % .
| Overview | Overview.1 | |
|---|---|---|
| 0 | Today last price | 7.2892 |
| 1 | Today Daily Change | -0.0040 |
| 2 | Today Daily Change % | -0.0500 |
| 3 | Today daily open | 7.2932 |
The pair remains strongly bullish on the daily timeframe. It trades above its 20 SMA @ 7.2615, 50 SMA 7.2261, 100 SMA @ 7.1176 and 200 SMA @ 7.0092.
| Trends | Trends.1 | |
|---|---|---|
| 0 | Daily SMA20 | 7.2615 |
| 1 | Daily SMA50 | 7.2261 |
| 2 | Daily SMA100 | 7.1176 |
| 3 | Daily SMA200 | 7.0092 |
The previous day high was 7.3056 while the previous day low was 7.2696. The daily 38.2% Fib levels comes at 7.2834, expected to provide support. Similarly, the daily 61.8% fib level is at 7.2919, expected to provide resistance.
Note the levels of interest below:
- Pivot support is noted at 7.2734, 7.2535, 7.2374
- Pivot resistance is noted at 7.3094, 7.3255, 7.3454
| Levels | Levels.1 |
|---|---|
| Previous Daily High | 7.3056 |
| Previous Daily Low | 7.2696 |
| Previous Weekly High | 7.3362 |
| Previous Weekly Low | 7.2676 |
| Previous Monthly High | 7.2744 |
| Previous Monthly Low | 7.1160 |
| Daily Fibonacci 38.2% | 7.2834 |
| Daily Fibonacci 61.8% | 7.2919 |
| Daily Pivot Point S1 | 7.2734 |
| Daily Pivot Point S2 | 7.2535 |
| Daily Pivot Point S3 | 7.2374 |
| Daily Pivot Point R1 | 7.3094 |
| Daily Pivot Point R2 | 7.3255 |
| Daily Pivot Point R3 | 7.3454 |
[/s2If]
Download Nehcap EAWe have two EAs that are operational on our LIVE accounts.
- EA-FIX: Check out the details here. Download EA-FIX . EA-FIX is a non-grid HFT scalper.
- EA-GROWTH: High quality low dd EA using trend grids. Download EA_GROWTHJoin Our Telegram Group
")


