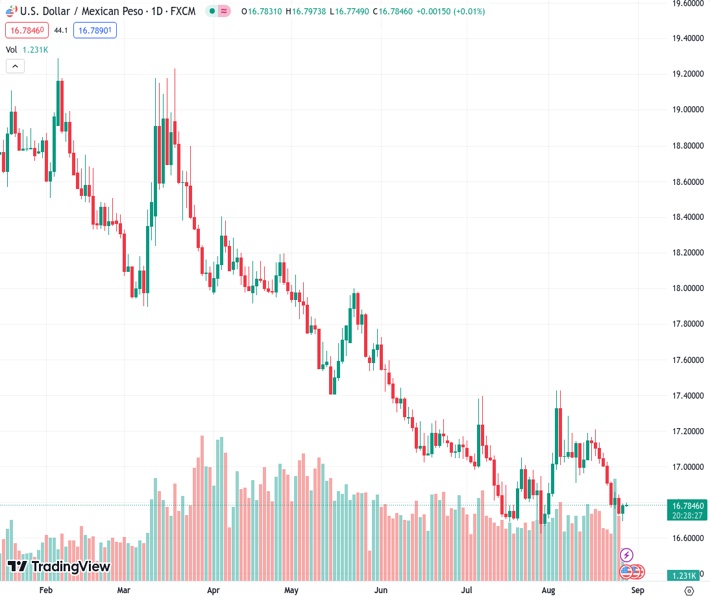
The US dollar to Mexican peso exchange rate, currently at 16.7851, has increased slightly after hitting a low point for the month. Analysis suggests that there is not much potential for significant further increase.
…
This is a premium post.
[s2If !current_user_can(access_s2member_level4)]Please register for FREE REGISTER to read full post below containing analysis. In case of any error or you think you are not able to read the full post below, please email us at support#nehcap.com [lwa][/s2If] [s2If current_user_can(access_s2member_level1)]
- USD/MXN edges higher after bouncing off monthly low.
The pair currently trades last at 16.7851.
The previous day high was 16.796 while the previous day low was 16.6945. The daily 38.2% Fib levels comes at 16.7572, expected to provide support. Similarly, the daily 61.8% fib level is at 16.7333, expected to provide support.
USD/MXN seesaws around 16.78-80 amid the early hours of Tuesday’s Asian session. In doing so, the Mexican Peso (MXN) pair struggles to defend the previous day’s rebound from a six-week-old horizontal support zone, as well as an upside break of an eight-day-long previous resistance line, ahead of Mexico’s second quarter (Q2) Gross Domestic Product (GDP). Also important to track is the US Conference Boards’ (CB) Consumer Confidence for August.
Also read: USD/MXN dives sharply despite hawkish Fed; eyes YTD low ahead of Mexico’s GDP
Given the upbeat RSI (14) line favoring the USD/MXN pair’s rebound from the key support zone, as well as an upside break of the previous resistance line, the buyers are likely to keep the reins unless the Mexican Q2 GDP data disappoints, expected 0.9% QoQ versus 1.0% prior.
With this, the latest recovery can approach the 200-SMA hurdle of around 16.95.
However, a downward-sloping resistance line from August 04, close to 17.05 by the press time, will challenge the USD/MXN bulls afterward.
In a case where the Mexican Peso (MXN) bears manage to conquer the 17.05 mark, the 17.20 level mark acts as a buffer during the run-up targeting the fresh monthly high, currently around 17.43.
On the flip side, the aforementioned resistance-turned-support line restricts the immediate USD/MXN downside near 16.73.
Following that, multiple levels marked since July 17, close to 16.70–69, will be crucial to watch as a clear downside break of the same won’t hesitate to refresh the multi-year low marked in July around 16.62.
Trend: Limited upside expected
Technical Levels: Supports and Resistances
USDMXN currently trading at 16.7862 at the time of writing. Pair opened at 16.7898 and is trading with a change of -0.02% % .
| Overview | Overview.1 | |
|---|---|---|
| 0 | Today last price | 16.7862 |
| 1 | Today Daily Change | -0.0036 |
| 2 | Today Daily Change % | -0.02% |
| 3 | Today daily open | 16.7898 |
The pair remains strongly bearish on the daily time frame. It trades below the 20 SMA @ 17.0148, 50 SMA 16.9925, 100 SMA @ 17.351 and 200 SMA @ 18.1138.
| Trends | Trends.1 | |
|---|---|---|
| 0 | Daily SMA20 | 17.0148 |
| 1 | Daily SMA50 | 16.9925 |
| 2 | Daily SMA100 | 17.3510 |
| 3 | Daily SMA200 | 18.1138 |
The previous day high was 16.796 while the previous day low was 16.6945. The daily 38.2% Fib levels comes at 16.7572, expected to provide support. Similarly, the daily 61.8% fib level is at 16.7333, expected to provide support.
Note the levels of interest below:
- Pivot support is noted at 16.7242, 16.6586, 16.6227
- Pivot resistance is noted at 16.8257, 16.8616, 16.9272
| Levels | Levels.1 |
|---|---|
| Previous Daily High | 16.7960 |
| Previous Daily Low | 16.6945 |
| Previous Weekly High | 17.0800 |
| Previous Weekly Low | 16.7366 |
| Previous Monthly High | 17.3957 |
| Previous Monthly Low | 16.6258 |
| Daily Fibonacci 38.2% | 16.7572 |
| Daily Fibonacci 61.8% | 16.7333 |
| Daily Pivot Point S1 | 16.7242 |
| Daily Pivot Point S2 | 16.6586 |
| Daily Pivot Point S3 | 16.6227 |
| Daily Pivot Point R1 | 16.8257 |
| Daily Pivot Point R2 | 16.8616 |
| Daily Pivot Point R3 | 16.9272 |
[/s2If]
Download Nehcap EAWe have two EAs that are operational on our LIVE accounts.
- EA-FIX: Check out the details here. Download EA-FIX . EA-FIX is a non-grid HFT scalper.
- EA-GROWTH: High quality low dd EA using trend grids. Download EA_GROWTHJoin Our Telegram Group
")


