The price of silver, represented by #XAGUSD, is experiencing a lack of momentum as buyers lose interest near the monthly peak. According to the perspective of nehcap, a withdrawal or decline in price is anticipated.
…
This is a premium post.
[s2If !current_user_can(access_s2member_level4)]Please register for FREE REGISTER to read full post below containing analysis. In case of any error or you think you are not able to read the full post below, please email us at support#nehcap.com [lwa][/s2If] [s2If current_user_can(access_s2member_level1)]
- Silver Price remains sluggish as buyers run out of steam around monthly high.
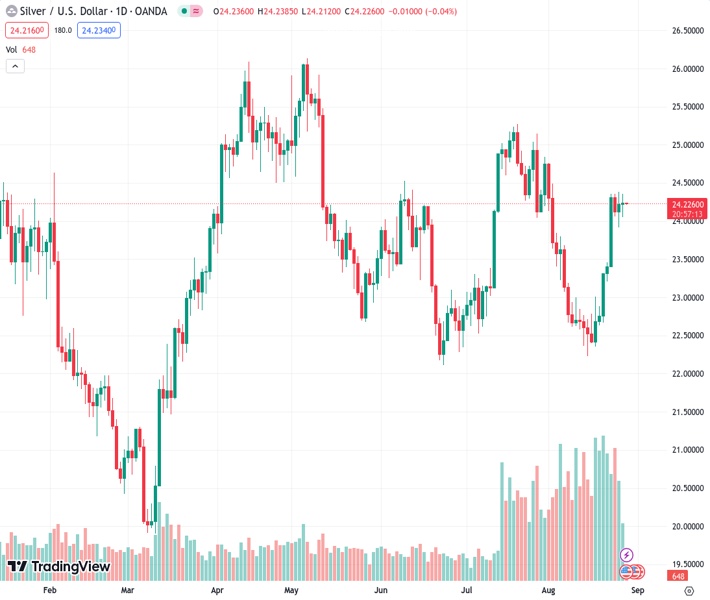
The pair currently trades last at 24.212.
The previous day high was 24.38 while the previous day low was 23.92. The daily 38.2% Fib levels comes at 24.21, expected to provide support. Similarly, the daily 61.8% fib level is at 24.1, expected to provide support.
Silver Price (XAG/USD) remains lackluster around $24.25 during the early hours of Tuesday’s Asian session, after failing to cross a one-week-long horizontal hurdle the previous day.
That said, the bearish MACD signals join the RSI (14) line’s retreat from the overbought territory to suggest a consolidation in the XAG/USD price amid sluggish markets, as well as the cautious mood ahead of the mid-tier US data.
With this, the bright metal’s fall towards the $24.00 round figure appears imminent. However, the Silver Price remains on the buyer’s radar unless it stays beyond the 200-SMA support of around $23.85.
In a case where the XAG/USD remains bearish past $23.85, the 50% Fibonacci retracement of June-July upside and a two-week-old rising support line, respectively near $23.70 and $23.45, will challenge the bears.
It’s worth noting that the 61.8% Fibonacci retracement, also known as the “Golden Fibonacci Ratio, of around $23.30 acts as the final defense of the Silver buyers.
On the flip side, the aforementioned one-week-old horizontal resistance area surrounding $24.35-40 guards immediate recovery of the Silver Price ahead of a downward-sloping resistance line from July 20, close to $24.60 of late.
Trend: Pullback expected
Technical Levels: Supports and Resistances
XAGUSD currently trading at 24.22 at the time of writing. Pair opened at 24.24 and is trading with a change of -0.08% % .
| Overview | Overview.1 | |
|---|---|---|
| 0 | Today last price | 24.22 |
| 1 | Today Daily Change | -0.02 |
| 2 | Today Daily Change % | -0.08% |
| 3 | Today daily open | 24.24 |
The pair remains strongly bullish on the daily timeframe. It trades above its 20 SMA @ 23.32, 50 SMA 23.53, 100 SMA @ 23.98 and 200 SMA @ 23.35.
| Trends | Trends.1 | |
|---|---|---|
| 0 | Daily SMA20 | 23.32 |
| 1 | Daily SMA50 | 23.53 |
| 2 | Daily SMA100 | 23.98 |
| 3 | Daily SMA200 | 23.35 |
The previous day high was 24.38 while the previous day low was 23.92. The daily 38.2% Fib levels comes at 24.21, expected to provide support. Similarly, the daily 61.8% fib level is at 24.1, expected to provide support.
Note the levels of interest below:
- Pivot support is noted at 23.98, 23.72, 23.51
- Pivot resistance is noted at 24.45, 24.65, 24.91
| Levels | Levels.1 |
|---|---|
| Previous Daily High | 24.38 |
| Previous Daily Low | 23.92 |
| Previous Weekly High | 24.38 |
| Previous Weekly Low | 22.67 |
| Previous Monthly High | 25.27 |
| Previous Monthly Low | 22.52 |
| Daily Fibonacci 38.2% | 24.21 |
| Daily Fibonacci 61.8% | 24.10 |
| Daily Pivot Point S1 | 23.98 |
| Daily Pivot Point S2 | 23.72 |
| Daily Pivot Point S3 | 23.51 |
| Daily Pivot Point R1 | 24.45 |
| Daily Pivot Point R2 | 24.65 |
| Daily Pivot Point R3 | 24.91 |
[/s2If]
Download Nehcap EAWe have two EAs that are operational on our LIVE accounts.
- EA-FIX: Check out the details here. Download EA-FIX . EA-FIX is a non-grid HFT scalper.
- EA-GROWTH: High quality low dd EA using trend grids. Download EA_GROWTHJoin Our Telegram Group
")


