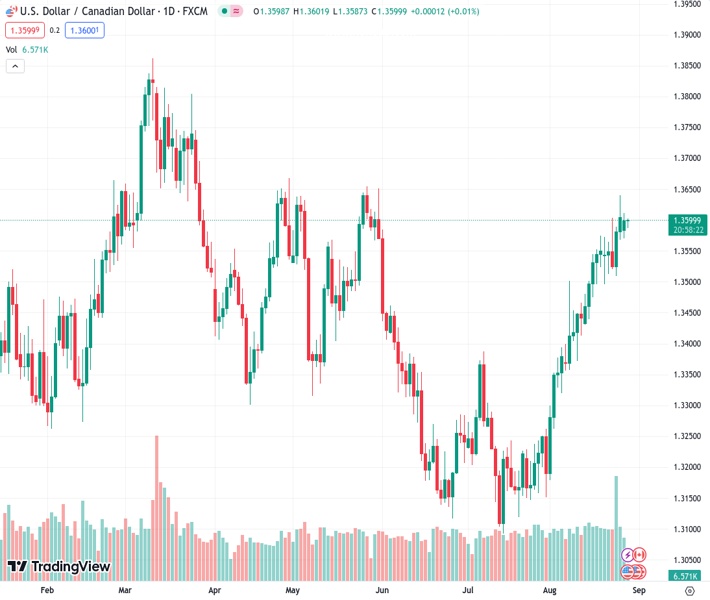
The USDCAD currency pair, at a rate of 1.36010, moves back and forth within a small range of 1.3570 to 1.3610.
…
This is a premium post.
[s2If !current_user_can(access_s2member_level4)]Please register for FREE REGISTER to read full post below containing analysis. In case of any error or you think you are not able to read the full post below, please email us at support#nehcap.com [lwa][/s2If] [s2If current_user_can(access_s2member_level1)]
- USD/CAD oscillates in a narrow trading range between 1.3570-1.3610.
The pair currently trades last at 1.36010.
The previous day high was 1.364 while the previous day low was 1.3569. The daily 38.2% Fib levels comes at 1.3613, expected to provide resistance. Similarly, the daily 61.8% fib level is at 1.3596, expected to provide support.
The USD/CAD pair trades sideways around 1.3600 during the early Asian session on Tuesday. The US Dollar Index (DXY struggles to find a decisive direction and hovers around 104.00. Market participants await the US economic data and Canadian growth numbers for fresh impetus. The closely watched event this week will be the US Nonfarm Payroll due on Friday and it could trigger volatility in the market.
Investors digest the Jackson Hole Symposium and shift their focus to the US economic data. That said, Chairman Jerome Powell opened the door for an additional rate hike if required. However, it would be determined by incoming data. The market discounts modest odds of a hike in September, but the probability of a 25 basis point (bps) hike in November increased to nearly 70%, according to World Interest Rates Probabilities (WIRP). On Monday, the Federal Reserve Bank of Dallas revealed that the Manufacturing Index for August rose to -17.2 from -20 prior, better than the -21.6 expected.
On the Canadian Dollar front, a decline in oil prices weakens the Loonie as Canada is the largest exporter of crude to the US. Nevertheless, the positive development from China, the major oil importer in the world might lift the Loonie against its rivals. That said, Chinese authorities would reduce the 0.1% duty on stock trading to stimulate the capital market and strengthen investor confidence.
Last week, monthly Canadian Retail Sales for June expanded by 0.1% from the previous month. The figure came in better than the expectation of 0%. Market players will take cues from the Canadian annual Gross Domestic Product (GDP) on Friday. The weaker-than-expected growth number would convince the Bank of Canada (BoC) to maintain the interest rates unchanged at 5%.
Looking ahead, traders will keep an eye on the Canadian annual GDP for the second quarter. The growth number is expected to expand by 1.2%. On the US docket, market players will monitor the US Nonfarm Payrolls due on Friday. The market anticipated that the US economy would create more than 170K jobs in August. Traders will take cues and find trading opportunities around the USD/CAD pair.
Technical Levels: Supports and Resistances
USDCAD currently trading at 1.3601 at the time of writing. Pair opened at 1.3601 and is trading with a change of 0.0 % .
| Overview | Overview.1 | |
|---|---|---|
| 0 | Today last price | 1.3601 |
| 1 | Today Daily Change | 0.0000 |
| 2 | Today Daily Change % | 0.0000 |
| 3 | Today daily open | 1.3601 |
The pair remains strongly bullish on the daily timeframe. It trades above its 20 SMA @ 1.3452, 50 SMA 1.3309, 100 SMA @ 1.3389 and 200 SMA @ 1.3459.
| Trends | Trends.1 | |
|---|---|---|
| 0 | Daily SMA20 | 1.3452 |
| 1 | Daily SMA50 | 1.3309 |
| 2 | Daily SMA100 | 1.3389 |
| 3 | Daily SMA200 | 1.3459 |
The previous day high was 1.364 while the previous day low was 1.3569. The daily 38.2% Fib levels comes at 1.3613, expected to provide resistance. Similarly, the daily 61.8% fib level is at 1.3596, expected to provide support.
Note the levels of interest below:
- Pivot support is noted at 1.3567, 1.3533, 1.3496
- Pivot resistance is noted at 1.3638, 1.3674, 1.3709
| Levels | Levels.1 |
|---|---|
| Previous Daily High | 1.3640 |
| Previous Daily Low | 1.3569 |
| Previous Weekly High | 1.3640 |
| Previous Weekly Low | 1.3496 |
| Previous Monthly High | 1.3387 |
| Previous Monthly Low | 1.3093 |
| Daily Fibonacci 38.2% | 1.3613 |
| Daily Fibonacci 61.8% | 1.3596 |
| Daily Pivot Point S1 | 1.3567 |
| Daily Pivot Point S2 | 1.3533 |
| Daily Pivot Point S3 | 1.3496 |
| Daily Pivot Point R1 | 1.3638 |
| Daily Pivot Point R2 | 1.3674 |
| Daily Pivot Point R3 | 1.3709 |
[/s2If]
Download Nehcap EAWe have two EAs that are operational on our LIVE accounts.
- EA-FIX: Check out the details here. Download EA-FIX . EA-FIX is a non-grid HFT scalper.
- EA-GROWTH: High quality low dd EA using trend grids. Download EA_GROWTHJoin Our Telegram Group
")


