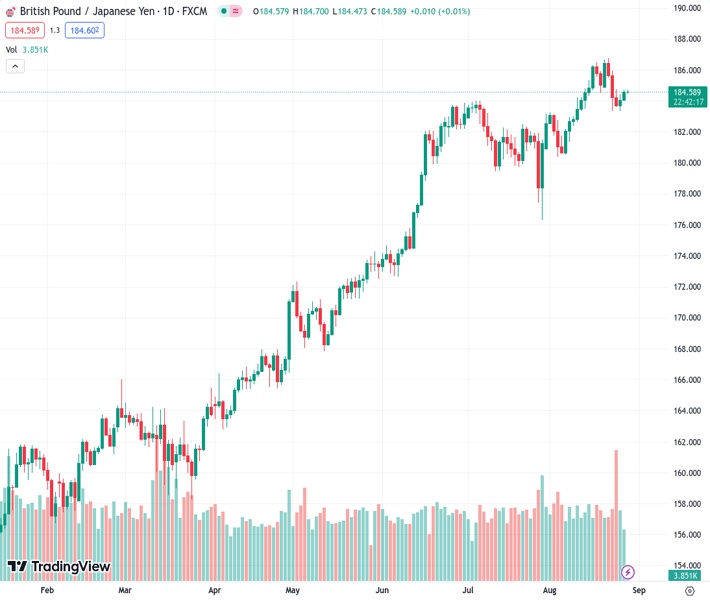
GBPJPY traded at a value of 184.582 and increased past the level of 184.50, maintaining stability above the 20-day simple moving average.
…
This is a premium post.
[s2If !current_user_can(access_s2member_level4)]Please register for FREE REGISTER to read full post below containing analysis. In case of any error or you think you are not able to read the full post below, please email us at support#nehcap.com [lwa][/s2If] [s2If current_user_can(access_s2member_level1)]
- GBP/JPY rose above 184.50, consolidating above the 20-day SMA.
The pair currently trades last at 184.582.
The previous day high was 184.41 while the previous day low was 183.36. The daily 38.2% Fib levels comes at 184.01, expected to provide support. Similarly, the daily 61.8% fib level is at 183.76, expected to provide support.
The GBP/JPY cross closed on Monday with consecutive gains, but bulls seem to be running out of steam.
That being said, fundamentals favour the bulls over the bears. The Bank of Japan (BoJ) has stated changes to monetary policy will only be entertained once local wage and inflation indicators match their projections. On the other hand, investors are pricing in that the Bank of England (BoE) will lift rates to 6%, and monetary policy divergences should maintain the bullish bias intact. On the data front, investors will eye labour market data on Tuesday from Japan and Retail Sales figures from July on Wednesday.
However, on the daily chart for the short term, the Relative Strength Index (RSI) has turned flat above its midline. At the same time, the Moving Average Convergence (MACD) histogram displays increasing red bars, signifying that the bears are slowly gaining ground. There are also signs of exhaustion on the shorter four-hour chart, with the RSI and MACD turning flat in positive territory.
In terms of upcoming supports and resistances, immediate resistances for the bulls are given by the 185.00 area, followed by the 185.80 zone and the cycle high of 186.75 struck last Tuesday. On the downside, the 20-day SMA at 183.95 offers strong support for the cross. If lost, the pair could retest the 183.00 and 181.00 levels.
Technical Levels: Supports and Resistances
GBPJPY currently trading at 184.66 at the time of writing. Pair opened at 184.23 and is trading with a change of 0.23 % .
| Overview | Overview.1 | |
|---|---|---|
| 0 | Today last price | 184.66 |
| 1 | Today Daily Change | 0.43 |
| 2 | Today Daily Change % | 0.23 |
| 3 | Today daily open | 184.23 |
The pair remains strongly bullish on the daily timeframe. It trades above its 20 SMA @ 183.83, 50 SMA 182.66, 100 SMA @ 176.84 and 200 SMA @ 169.56.
| Trends | Trends.1 | |
|---|---|---|
| 0 | Daily SMA20 | 183.83 |
| 1 | Daily SMA50 | 182.66 |
| 2 | Daily SMA100 | 176.84 |
| 3 | Daily SMA200 | 169.56 |
The previous day high was 184.41 while the previous day low was 183.36. The daily 38.2% Fib levels comes at 184.01, expected to provide support. Similarly, the daily 61.8% fib level is at 183.76, expected to provide support.
Note the levels of interest below:
- Pivot support is noted at 183.59, 182.95, 182.54
- Pivot resistance is noted at 184.64, 185.05, 185.69
| Levels | Levels.1 |
|---|---|
| Previous Daily High | 184.41 |
| Previous Daily Low | 183.36 |
| Previous Weekly High | 186.77 |
| Previous Weekly Low | 183.36 |
| Previous Monthly High | 184.02 |
| Previous Monthly Low | 176.32 |
| Daily Fibonacci 38.2% | 184.01 |
| Daily Fibonacci 61.8% | 183.76 |
| Daily Pivot Point S1 | 183.59 |
| Daily Pivot Point S2 | 182.95 |
| Daily Pivot Point S3 | 182.54 |
| Daily Pivot Point R1 | 184.64 |
| Daily Pivot Point R2 | 185.05 |
| Daily Pivot Point R3 | 185.69 |
[/s2If]
Download Nehcap EAWe have two EAs that are operational on our LIVE accounts.
- EA-FIX: Check out the details here. Download EA-FIX . EA-FIX is a non-grid HFT scalper.
- EA-GROWTH: High quality low dd EA using trend grids. Download EA_GROWTHJoin Our Telegram Group
")


