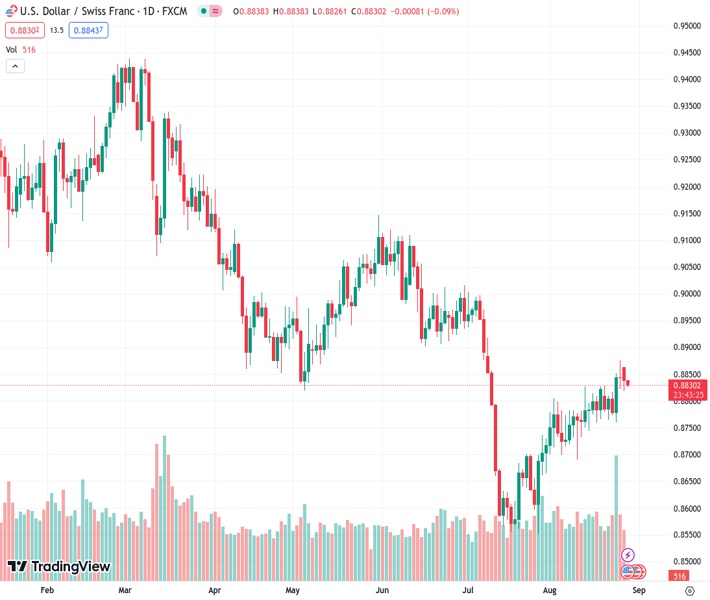
The USDCHF currency pair, currently trading at 0.88382, is experiencing losses for the second day in a row as it trades at 0.8840.
…
This is a premium post.
[s2If !current_user_can(access_s2member_level4)]Please register for FREE REGISTER to read full post below containing analysis. In case of any error or you think you are not able to read the full post below, please email us at support#nehcap.com [lwa][/s2If] [s2If current_user_can(access_s2member_level1)]
- USD/CHF trades at 0.8840, tallying losses for a second consecutive day.
The pair currently trades last at 0.88382.
The previous day high was 0.8876 while the previous day low was 0.8822. The daily 38.2% Fib levels comes at 0.8855, expected to provide resistance. Similarly, the daily 61.8% fib level is at 0.8842, expected to provide resistance.
At the start of the week, the USD traded soft against most of its rivals, and the DXY index consolidated the 0.80% gains seen on Thursday and Friday. Nonfarm payrolls and economic activity figures will be the week’s highlight for the US, and on the CHF’s side, investors await Retail Sales and Inflation figures from July and August.
After the Chairman of the Federal Reserve (Fed) Jerome Powell stated on Friday that the bank would maintain rates at restrictive levels until the economy shows signs of cooling, he also left the door open for another hike. He pointed out that the bank will proceed “carefully” in the next decisions. Following his words, the US bond yields rose, signifying that the markets placed bets on a more hawkish Fed.
In that sense, World Interest Rates Probabilities (WIRP) suggests that markets discount low odds of a hike in September, but the odds of a 25 basis point (bps) increase in November rose to nearly 70%. Focus now shifts to key labour market figures, including JOLT job Opening, ADP Employment Change, and August’s Nonfarm Payroll report, as a tighter labour market would give the Fed the green light to continue tightening.
Analysing the daily chart, a neutral to bearish technical outlook is evident for USD/CHF, suggesting that the bears are gaining momentum but still do not have an upperhand over the bulls for the short term. The Relative Strength Index (RSI) has a negative slope above its midline, while the Moving Average Convergence (MACD) prints stagnant green bars. On the other hand, the pair is above the 20-day Simple Moving Average (SMA) but below the 100 and 200-day indicating that there is still some light for the bulls and that the bears have still more ground to cover
Support levels: 0.8830, 0.8800, 0.8780 (20-day SMA).
Resistance levels: 0.8890 (100-day SMA), 0.8915, 0.8950.
Technical Levels: Supports and Resistances
USDCHF currently trading at 0.8839 at the time of writing. Pair opened at 0.8846 and is trading with a change of -0.08 % .
| Overview | Overview.1 | |
|---|---|---|
| 0 | Today last price | 0.8839 |
| 1 | Today Daily Change | -0.0007 |
| 2 | Today Daily Change % | -0.0800 |
| 3 | Today daily open | 0.8846 |
The pair is trading above its 20 Daily moving average @ 0.8777, above its 50 Daily moving average @ 0.8797 , below its 100 Daily moving average @ 0.889 and below its 200 Daily moving average @ 0.9084
| Trends | Trends.1 | |
|---|---|---|
| 0 | Daily SMA20 | 0.8777 |
| 1 | Daily SMA50 | 0.8797 |
| 2 | Daily SMA100 | 0.8890 |
| 3 | Daily SMA200 | 0.9084 |
The previous day high was 0.8876 while the previous day low was 0.8822. The daily 38.2% Fib levels comes at 0.8855, expected to provide resistance. Similarly, the daily 61.8% fib level is at 0.8842, expected to provide resistance.
Note the levels of interest below:
- Pivot support is noted at 0.882, 0.8793, 0.8765
- Pivot resistance is noted at 0.8874, 0.8902, 0.8928
| Levels | Levels.1 |
|---|---|
| Previous Daily High | 0.8876 |
| Previous Daily Low | 0.8822 |
| Previous Weekly High | 0.8876 |
| Previous Weekly Low | 0.8760 |
| Previous Monthly High | 0.9005 |
| Previous Monthly Low | 0.8552 |
| Daily Fibonacci 38.2% | 0.8855 |
| Daily Fibonacci 61.8% | 0.8842 |
| Daily Pivot Point S1 | 0.8820 |
| Daily Pivot Point S2 | 0.8793 |
| Daily Pivot Point S3 | 0.8765 |
| Daily Pivot Point R1 | 0.8874 |
| Daily Pivot Point R2 | 0.8902 |
| Daily Pivot Point R3 | 0.8928 |
[/s2If]
Download Nehcap EAWe have two EAs that are operational on our LIVE accounts.
- EA-FIX: Check out the details here. Download EA-FIX . EA-FIX is a non-grid HFT scalper.
- EA-GROWTH: High quality low dd EA using trend grids. Download EA_GROWTHJoin Our Telegram Group
")


