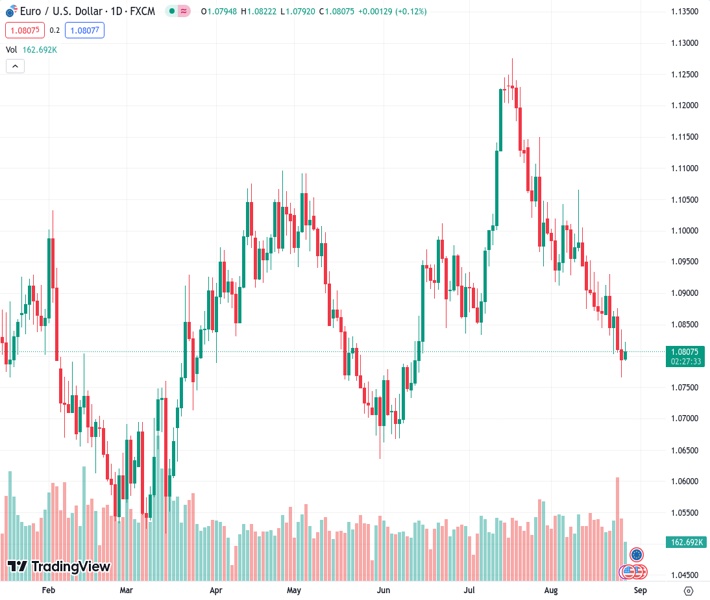
The value of EURUSD reached close to 1.0810, surpassing the 200-day SMA (Simple Moving Average) of 1.0805.
…
This is a premium post.
[s2If !current_user_can(access_s2member_level4)]Please register for FREE REGISTER to read full post below containing analysis. In case of any error or you think you are not able to read the full post below, please email us at support#nehcap.com [lwa][/s2If] [s2If current_user_can(access_s2member_level1)]
- The EUR/USD rose near 1.0810, above the 200-day SMA of 1.0805.
The pair currently trades last at 1.08080.
The previous day high was 1.0842 while the previous day low was 1.0766. The daily 38.2% Fib levels comes at 1.0795, expected to provide support. Similarly, the daily 61.8% fib level is at 1.0813, expected to provide resistance.
In Monday’s session, the USD is trading weak against most of its rivals, mainly driven by a slight consolidation and a risk-positive market environment. On the other hand, the European Central Bank’s hawkish rhetoric is gaining more ground while markets still asses Jerome Powell’s speech on Friday.
During his speech at the Jackson Hole Symposium, Chair Powell didn’t commit to another hike but pointed out that the economy hasn’t cooled down as expected and that as long as inflation doesn’t give in, the Federal Reserve (Fed) will maintain rates at a restrictive stance. As a reaction, the US yields sharply rose, as according to the CME FedWatch tool, investors are now betting on nearly 50% odds of a hike in November.
That said, US bond yields are pulling back on Monday, although they maintain elevated levels. The rate for the 2-year bond stands at 5.05%, whereas the rates for the 5-year and 10-year bonds are at 4.41% and 4.22%, respectively. In addition, the USD measured by the DXY index slightly retreated but still traded at its highest level since early June, above the 104.00 zone.
On the Euro’s side, Robert Holzmann from the ECB made it clear at the start of the week that he sees “a case for pushing on with rate increases without taking a pause” in case no surprises arise. Still, he confirmed the ECB’s data-dependent approach. In line with that, investors will eye crucial inflation figures from Germany and the EU from August to be released on Wednesday and Thursday to continue placing their bets on the ECB’s next decisions.
In the meantime, according to the World Interest Rates Probabilities (WIRP) tool, markets are currently discounting a 45% probability of a 25bps increase in the upcoming September 14, 2023 meeting. Moving forward, the likelihood of a 25bps hike stands at 66% in October, followed by a 75% chance of a similar increase in the December meeting. This anticipated rate hike trajectory would result in a target rate of 5%.
From a technical standpoint, the EUR/USD maintains a bearish outlook for the short term, as observed on the daily chart. The Relative Strength Index (RSI) is comfortably positioned in the negative territory below its midline. It is also complemented by a negative signal from the Moving Average Convergence Divergence (MACD), which shows red bars, signalling bearish momentum. Moreover, the pair is below the 20,100 and 200-day Simple Moving Averages (SMAs), suggesting that the bears are firmly in control of the bigger picture.
Support levels: 1.0800 (200-day SMA), 1.0780, 1.0750.
Resistance levels: 1.0830,1.0850, 1.0900.
Technical Levels: Supports and Resistances
EURUSD currently trading at 1.0807 at the time of writing. Pair opened at 1.0796 and is trading with a change of 0.1 % .
| Overview | Overview.1 | |
|---|---|---|
| 0 | Today last price | 1.0807 |
| 1 | Today Daily Change | 0.0011 |
| 2 | Today Daily Change % | 0.1000 |
| 3 | Today daily open | 1.0796 |
The pair is trading below its 20 Daily moving average @ 1.0919, below its 50 Daily moving average @ 1.0977 , below its 100 Daily moving average @ 1.0928 and above its 200 Daily moving average @ 1.0804
| Trends | Trends.1 | |
|---|---|---|
| 0 | Daily SMA20 | 1.0919 |
| 1 | Daily SMA50 | 1.0977 |
| 2 | Daily SMA100 | 1.0928 |
| 3 | Daily SMA200 | 1.0804 |
The previous day high was 1.0842 while the previous day low was 1.0766. The daily 38.2% Fib levels comes at 1.0795, expected to provide support. Similarly, the daily 61.8% fib level is at 1.0813, expected to provide resistance.
Note the levels of interest below:
- Pivot support is noted at 1.0761, 1.0725, 1.0685
- Pivot resistance is noted at 1.0836, 1.0877, 1.0912
| Levels | Levels.1 |
|---|---|
| Previous Daily High | 1.0842 |
| Previous Daily Low | 1.0766 |
| Previous Weekly High | 1.0930 |
| Previous Weekly Low | 1.0766 |
| Previous Monthly High | 1.1276 |
| Previous Monthly Low | 1.0834 |
| Daily Fibonacci 38.2% | 1.0795 |
| Daily Fibonacci 61.8% | 1.0813 |
| Daily Pivot Point S1 | 1.0761 |
| Daily Pivot Point S2 | 1.0725 |
| Daily Pivot Point S3 | 1.0685 |
| Daily Pivot Point R1 | 1.0836 |
| Daily Pivot Point R2 | 1.0877 |
| Daily Pivot Point R3 | 1.0912 |
[/s2If]
Download Nehcap EAWe have two EAs that are operational on our LIVE accounts.
- EA-FIX: Check out the details here. Download EA-FIX . EA-FIX is a non-grid HFT scalper.
- EA-GROWTH: High quality low dd EA using trend grids. Download EA_GROWTHJoin Our Telegram Group
")


