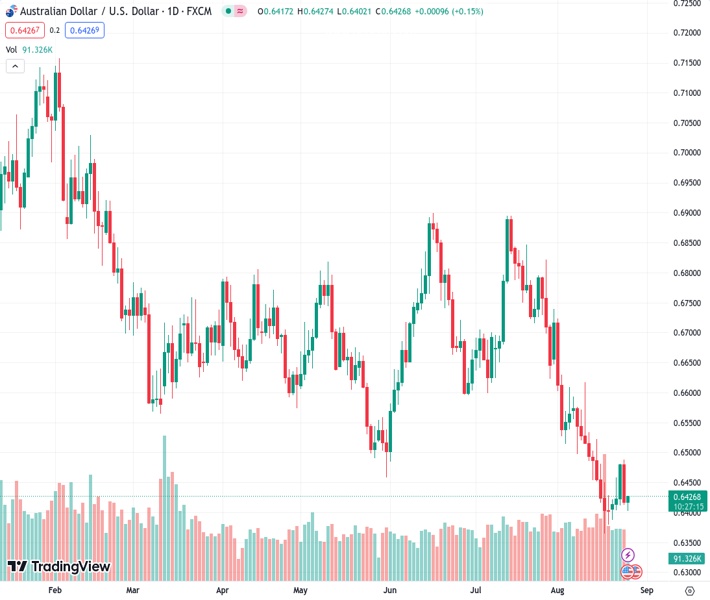
The AUDUSD, currently trading at 0.64257, experiences a slight decrease in confidence before the Jackson Hole Symposium, approaching the 0.6425 mark.
…
This is a premium post.
[s2If !current_user_can(access_s2member_level4)]Please register for FREE REGISTER to read full post below containing analysis. In case of any error or you think you are not able to read the full post below, please email us at support#nehcap.com [lwa][/s2If] [s2If current_user_can(access_s2member_level1)]
- AUD/USD delivers a less-confident pullback to near 0.6425 ahead of the Jackson Hole Symposium.
The pair currently trades last at 0.64257.
The previous day high was 0.6488 while the previous day low was 0.6413. The daily 38.2% Fib levels comes at 0.6442, expected to provide resistance. Similarly, the daily 61.8% fib level is at 0.6459, expected to provide resistance.
The AUD/USD pair rebounded after discovering buying interest near the round-level support of 0.6400 in the European session. The Aussie asset delivers a pullback move to near 0.6425 but the downside bias is still solid amid cautious market mood ahead of the Jackson Hole Symposium.
S&P500 futures add some gains in London but overall market sentiment remains jittery as hawkish interest rate guidance from Federal Reserve (Fed) chair Jerome Powell at Jackson Hole will impact the growth outlook. The US Dollar Index (DXY) faces some pressure after refreshing its 11-week high at 104.30.
Going forward, the Australian Dollar will dance to the tunes of the monthly Retail Sales data for July, which will be published on Monday. In June, consumer spending slowed down by 0.8%.
AUD/USD delivers a pullback and is testing the breakdown of the Rising Channel chart pattern formed on a two-hour scale. A breakdown of the aforementioned chart pattern confirms that the trend has turned bearish now. The 20-period Exponential Moving Average (EMA) at 0.6430 is expected to act as a barrier for the Aussie bulls.
The Relative Strength Index (RSI) (14) is on the verge of shifting into the bearish range of 20.00-40.00. An occurrence of the same will activate the downside momentum.
Going forward, a breakdown below August 22 low at 0.6403 will expose the asset to August low at 0.6364, followed by the round-level support at 0.6300.
In an alternate scenario, a recovery move above the intraday high at 0.6490 will drive the asset toward August 9 high at 0.6571. A breach of the latter will expose the asset to August 10 high at 0.6616.
Technical Levels: Supports and Resistances
AUDUSD currently trading at 0.6423 at the time of writing. Pair opened at 0.6417 and is trading with a change of 0.09 % .
| Overview | Overview.1 | |
|---|---|---|
| 0 | Today last price | 0.6423 |
| 1 | Today Daily Change | 0.0006 |
| 2 | Today Daily Change % | 0.0900 |
| 3 | Today daily open | 0.6417 |
The pair remains strongly bearish on the daily time frame. It trades below the 20 SMA @ 0.6511, 50 SMA 0.6646, 100 SMA @ 0.6657 and 200 SMA @ 0.6729.
| Trends | Trends.1 | |
|---|---|---|
| 0 | Daily SMA20 | 0.6511 |
| 1 | Daily SMA50 | 0.6646 |
| 2 | Daily SMA100 | 0.6657 |
| 3 | Daily SMA200 | 0.6729 |
The previous day high was 0.6488 while the previous day low was 0.6413. The daily 38.2% Fib levels comes at 0.6442, expected to provide resistance. Similarly, the daily 61.8% fib level is at 0.6459, expected to provide resistance.
Note the levels of interest below:
- Pivot support is noted at 0.6391, 0.6364, 0.6315
- Pivot resistance is noted at 0.6466, 0.6515, 0.6542
| Levels | Levels.1 |
|---|---|
| Previous Daily High | 0.6488 |
| Previous Daily Low | 0.6413 |
| Previous Weekly High | 0.6522 |
| Previous Weekly Low | 0.6364 |
| Previous Monthly High | 0.6895 |
| Previous Monthly Low | 0.6599 |
| Daily Fibonacci 38.2% | 0.6442 |
| Daily Fibonacci 61.8% | 0.6459 |
| Daily Pivot Point S1 | 0.6391 |
| Daily Pivot Point S2 | 0.6364 |
| Daily Pivot Point S3 | 0.6315 |
| Daily Pivot Point R1 | 0.6466 |
| Daily Pivot Point R2 | 0.6515 |
| Daily Pivot Point R3 | 0.6542 |
[/s2If]
Download Nehcap EAWe have two EAs that are operational on our LIVE accounts.
- EA-FIX: Check out the details here. Download EA-FIX . EA-FIX is a non-grid HFT scalper.
- EA-GROWTH: High quality low dd EA using trend grids. Download EA_GROWTHJoin Our Telegram Group
")


