The GBP/JPY pair remains stable around 183.80, as a result of the disappointing inflation data from Japan.
…
This is a premium post.
[s2If !current_user_can(access_s2member_level4)]Please register for FREE REGISTER to read full post below containing analysis. In case of any error or you think you are not able to read the full post below, please email us at support#nehcap.com [lwa][/s2If] [s2If current_user_can(access_s2member_level1)]
- GBP/JPY holds ground near 183.80 due to downbeat Japan’s inflation data.
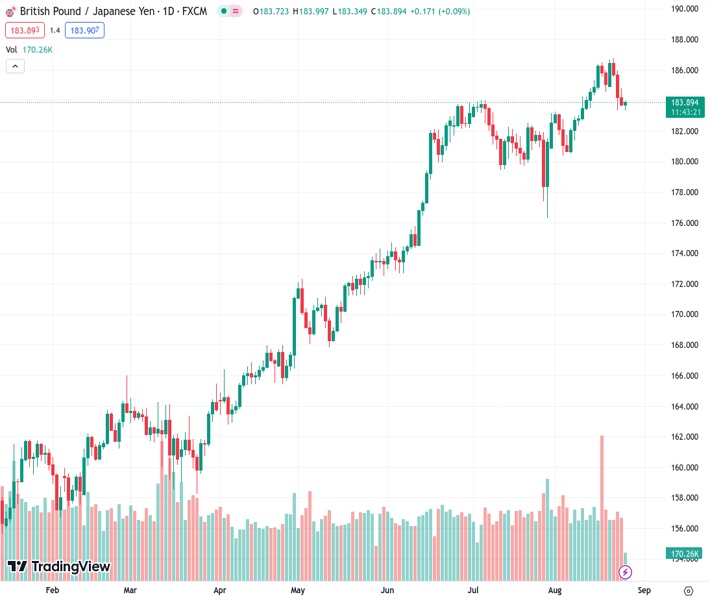
The pair currently trades last at 183.868.
The previous day high was 184.78 while the previous day low was 183.6. The daily 38.2% Fib levels comes at 184.05, expected to provide resistance. Similarly, the daily 61.8% fib level is at 184.33, expected to provide resistance.
GBP/JPY struggles to snap three-day losses, currently trading around 183.80 lined up with the 21-day Exponential Moving Average (EMA) during the European session on Friday. The cross experiences upward pressure due to downbeat Japan’s inflation data.
Tokyo Consumer Price Index (CPI) (YoY) declined to 2.9% in the month of August against the 3.0% expected, from the 3.2% prior. Tokyo CPI ex Food, Energy (YoY) remains unchanged at 4%, while Tokyo CPI ex Fresh Food (YoY) fell to 2.8% from the 3% figure in July, slightly lower than the market expectations of 2.9%.
The pair could meet support around the weekly low at 183.35, following the 38.2% Fibonacci retracement at 182.78 level. A firm break below the latter could open the doors for the GBP/JPY pair to navigate the region around the 50-day EMA at 181.61 level.
On the upside, the 184.00 psychological level appears to be the key resistance. A break above that level could support the pair to explore the area around nine-day EMA at 184.52.
The 14-day Relative Strength Index (RSI) remains below 50, which suggests a bearish bias of the GBP/JPY traders. The Moving Average Convergence Divergence (MACD) line stays above the centerline but lies below the signal line, which suggests that recent momentum is weaker.
Technical Levels: Supports and Resistances
GBPJPY currently trading at 183.77 at the time of writing. Pair opened at 183.74 and is trading with a change of 0.02 % .
| Overview | Overview.1 | |
|---|---|---|
| 0 | Today last price | 183.77 |
| 1 | Today Daily Change | 0.03 |
| 2 | Today Daily Change % | 0.02 |
| 3 | Today daily open | 183.74 |
The pair remains strongly bullish on the daily timeframe. It trades above its 20 SMA @ 183.69, 50 SMA 182.62, 100 SMA @ 176.64 and 200 SMA @ 169.47.
| Trends | Trends.1 | |
|---|---|---|
| 0 | Daily SMA20 | 183.69 |
| 1 | Daily SMA50 | 182.62 |
| 2 | Daily SMA100 | 176.64 |
| 3 | Daily SMA200 | 169.47 |
The previous day high was 184.78 while the previous day low was 183.6. The daily 38.2% Fib levels comes at 184.05, expected to provide resistance. Similarly, the daily 61.8% fib level is at 184.33, expected to provide resistance.
Note the levels of interest below:
- Pivot support is noted at 183.3, 182.87, 182.13
- Pivot resistance is noted at 184.47, 185.21, 185.64
| Levels | Levels.1 |
|---|---|
| Previous Daily High | 184.78 |
| Previous Daily Low | 183.60 |
| Previous Weekly High | 186.47 |
| Previous Weekly Low | 183.46 |
| Previous Monthly High | 184.02 |
| Previous Monthly Low | 176.32 |
| Daily Fibonacci 38.2% | 184.05 |
| Daily Fibonacci 61.8% | 184.33 |
| Daily Pivot Point S1 | 183.30 |
| Daily Pivot Point S2 | 182.87 |
| Daily Pivot Point S3 | 182.13 |
| Daily Pivot Point R1 | 184.47 |
| Daily Pivot Point R2 | 185.21 |
| Daily Pivot Point R3 | 185.64 |
[/s2If]
Download Nehcap EAWe have two EAs that are operational on our LIVE accounts.
- EA-FIX: Check out the details here. Download EA-FIX . EA-FIX is a non-grid HFT scalper.
- EA-GROWTH: High quality low dd EA using trend grids. Download EA_GROWTHJoin Our Telegram Group
")


