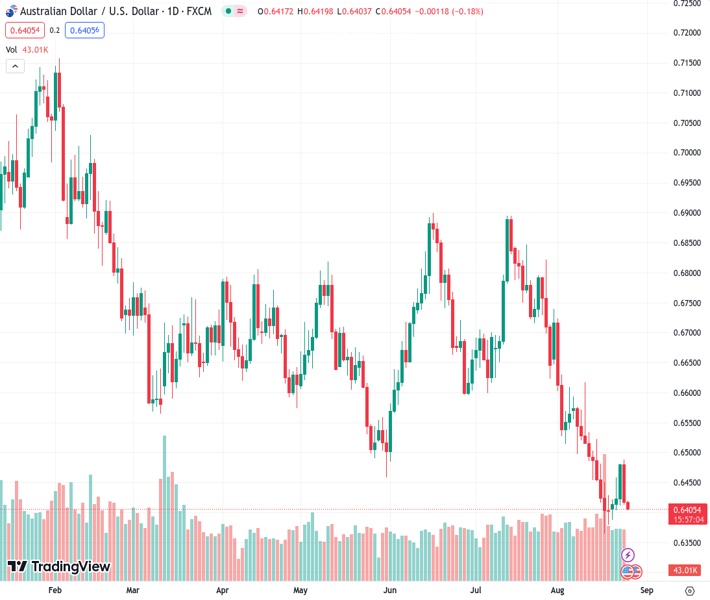
The #AUDUSD pair is currently trading at 0.64048, but it has slightly dropped to around 0.6410 due to positive economic data from the US.
…
This is a premium post.
[s2If !current_user_can(access_s2member_level4)]Please register for FREE REGISTER to read full post below containing analysis. In case of any error or you think you are not able to read the full post below, please email us at support#nehcap.com [lwa][/s2If] [s2If current_user_can(access_s2member_level1)]
- AUD/USD trades lower around 0.6410 on upbeat US economic data.
The pair currently trades last at 0.64048.
The previous day high was 0.6488 while the previous day low was 0.6413. The daily 38.2% Fib levels comes at 0.6442, expected to provide resistance. Similarly, the daily 61.8% fib level is at 0.6459, expected to provide resistance.
AUD/USD trades lower around 0.6410 during the Asian session on Friday, reversing from the weekly top. The pair experiences downward pressure due to upbeat United States (US) economic data overall, elevated US Treasury yields, and mixed sentiment around monetary policy tightening by the US Federal Reserve in the September meeting. Additionally, fading US-China optimism coupled with China’s economic challenges exert pressure on the Australian Dollar (AUD) as a result of the intricate export-trade ties between the two nations.
US Initial Jobless Claims suggested positive employment conditions, which have led to concerns about the inflation outlook in the US. For the week ending on August 18, the index fell to 230K lower than the expectations of remaining consistent as reported 240K prior. However, US Durable Goods Orders for July reported a reduction of 5.2% as compared to the market consensus of 4%, declining from the 4.4% reading in June.
The AUD/USD pair is weakening due to the mixed sentiments over more interest rate hikes by the US Fed, following Fed Chairman Jerome Powell’s speech at the Jackson Hole Symposium on Friday. Additionally, former St. Louis Federal Reserve President James Bullard made hawkish remarks, underpinning the US Dollar (USD). Bullard said “The reacceleration could put upward pressure on inflation and thus makes it impossible for the Fed to start cutting rates anytime soon” – Bloomberg. Conversely, Federal Reserve Bank of Philadelphia President Patrick Harker hinted at an end of the rate hike trajectory whereas the President of the Boston Federal Reserve defended maintaining a bias towards keeping rates at higher levels for an extended duration.
The US Dollar Index (DXY), which measures the performance of the Greenback against six major currencies, is continuing to extend gains as Fed Chair Powell’s speech looms. The spot price trades higher around 104.30 at the time of writing. Traders will closely monitor the central banks’ speeches, seeking insights into economic conditions and inflation outlook, which will influence the Fed’s decision on upcoming monetary policy.
Technical Levels: Supports and Resistances
AUDUSD currently trading at 0.6407 at the time of writing. Pair opened at 0.6417 and is trading with a change of -0.16 % .
| Overview | Overview.1 | |
|---|---|---|
| 0 | Today last price | 0.6407 |
| 1 | Today Daily Change | -0.0010 |
| 2 | Today Daily Change % | -0.1600 |
| 3 | Today daily open | 0.6417 |
The pair remains strongly bearish on the daily time frame. It trades below the 20 SMA @ 0.6511, 50 SMA 0.6646, 100 SMA @ 0.6657 and 200 SMA @ 0.6729.
| Trends | Trends.1 | |
|---|---|---|
| 0 | Daily SMA20 | 0.6511 |
| 1 | Daily SMA50 | 0.6646 |
| 2 | Daily SMA100 | 0.6657 |
| 3 | Daily SMA200 | 0.6729 |
The previous day high was 0.6488 while the previous day low was 0.6413. The daily 38.2% Fib levels comes at 0.6442, expected to provide resistance. Similarly, the daily 61.8% fib level is at 0.6459, expected to provide resistance.
Note the levels of interest below:
- Pivot support is noted at 0.6391, 0.6364, 0.6315
- Pivot resistance is noted at 0.6466, 0.6515, 0.6542
| Levels | Levels.1 |
|---|---|
| Previous Daily High | 0.6488 |
| Previous Daily Low | 0.6413 |
| Previous Weekly High | 0.6522 |
| Previous Weekly Low | 0.6364 |
| Previous Monthly High | 0.6895 |
| Previous Monthly Low | 0.6599 |
| Daily Fibonacci 38.2% | 0.6442 |
| Daily Fibonacci 61.8% | 0.6459 |
| Daily Pivot Point S1 | 0.6391 |
| Daily Pivot Point S2 | 0.6364 |
| Daily Pivot Point S3 | 0.6315 |
| Daily Pivot Point R1 | 0.6466 |
| Daily Pivot Point R2 | 0.6515 |
| Daily Pivot Point R3 | 0.6542 |
[/s2If]
Download Nehcap EAWe have two EAs that are operational on our LIVE accounts.
- EA-FIX: Check out the details here. Download EA-FIX . EA-FIX is a non-grid HFT scalper.
- EA-GROWTH: High quality low dd EA using trend grids. Download EA_GROWTHJoin Our Telegram Group
")


